. 2024 Oct 14;9(1):272.
doi: 10.1038/s41392-024-01973-3.

Aptamer-drug conjugates-loaded bacteria for pancreatic cancer synergistic therapy

Affiliations

Aptamer-drug conjugates-loaded bacteria for pancreatic cancer synergistic therapy

Yu Xiao et al. Signal Transduct Target Ther. .

Abstract

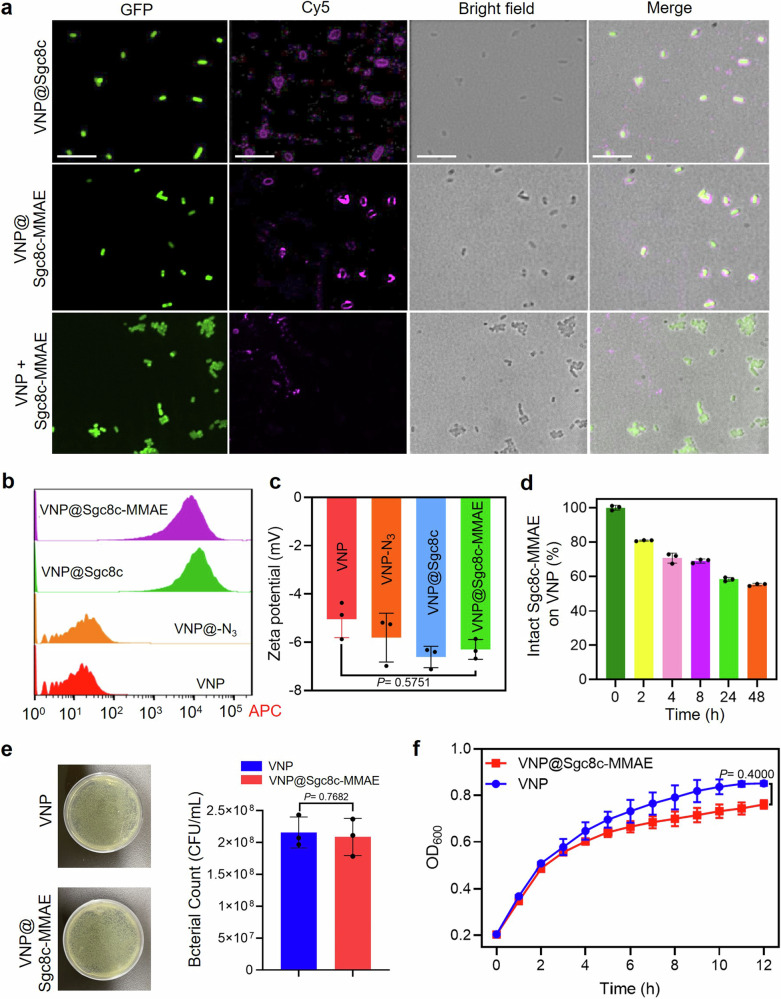
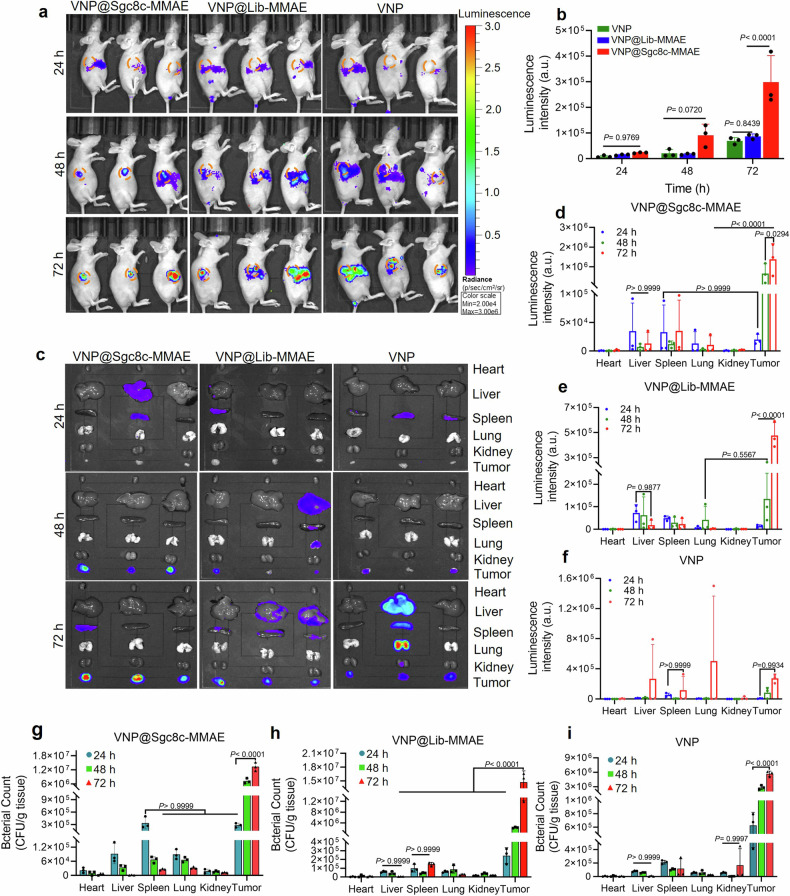
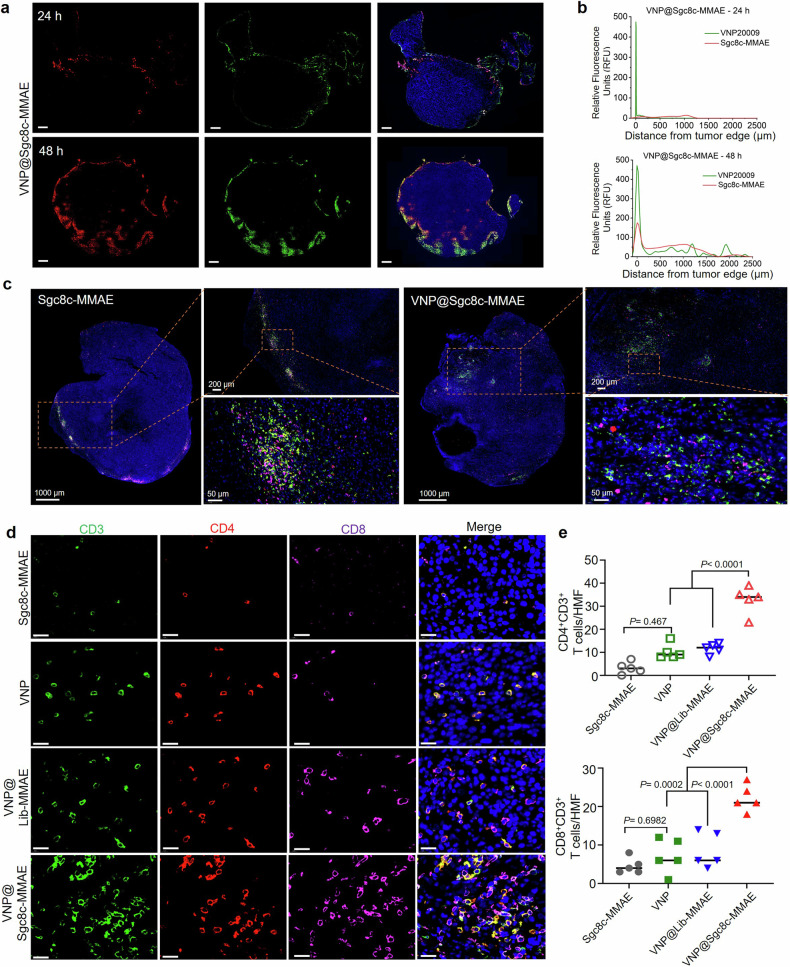
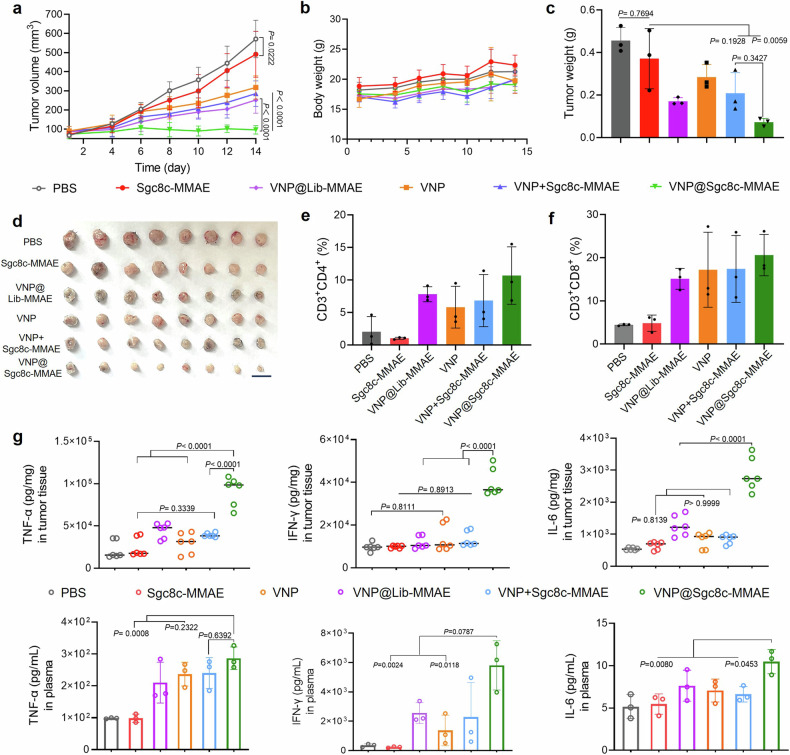
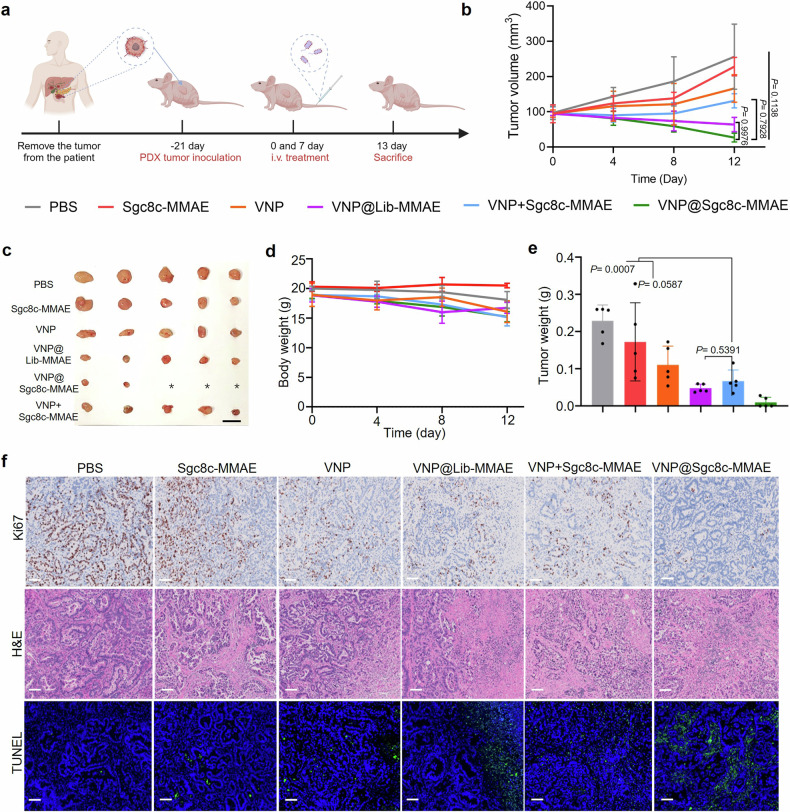
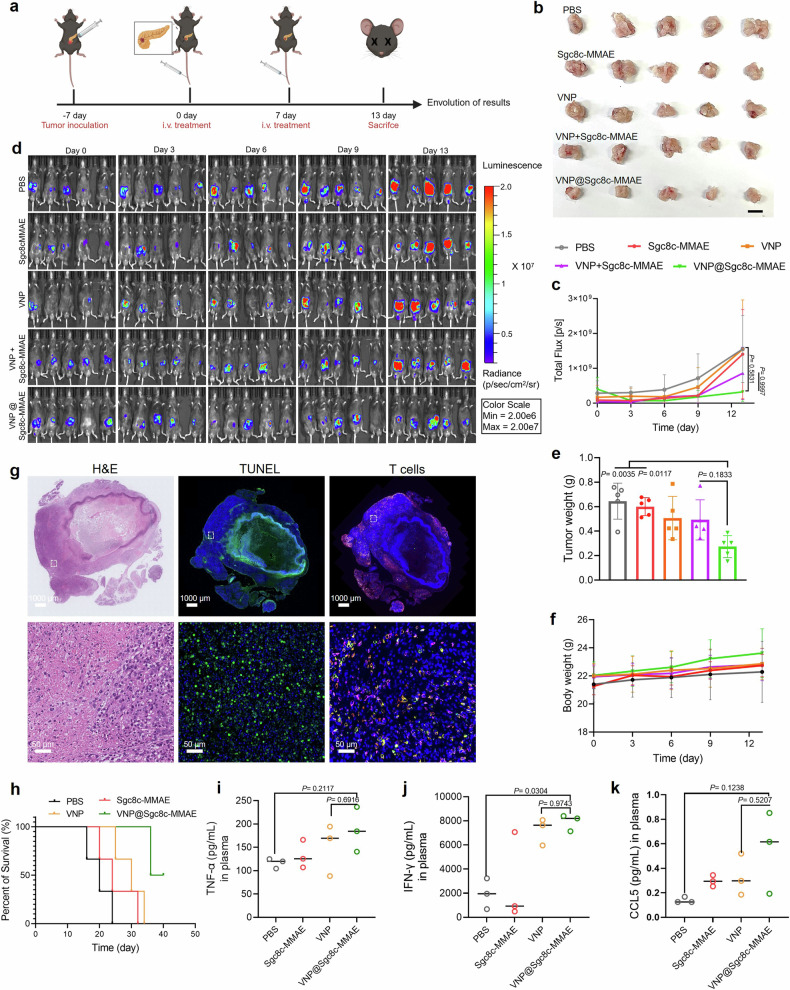
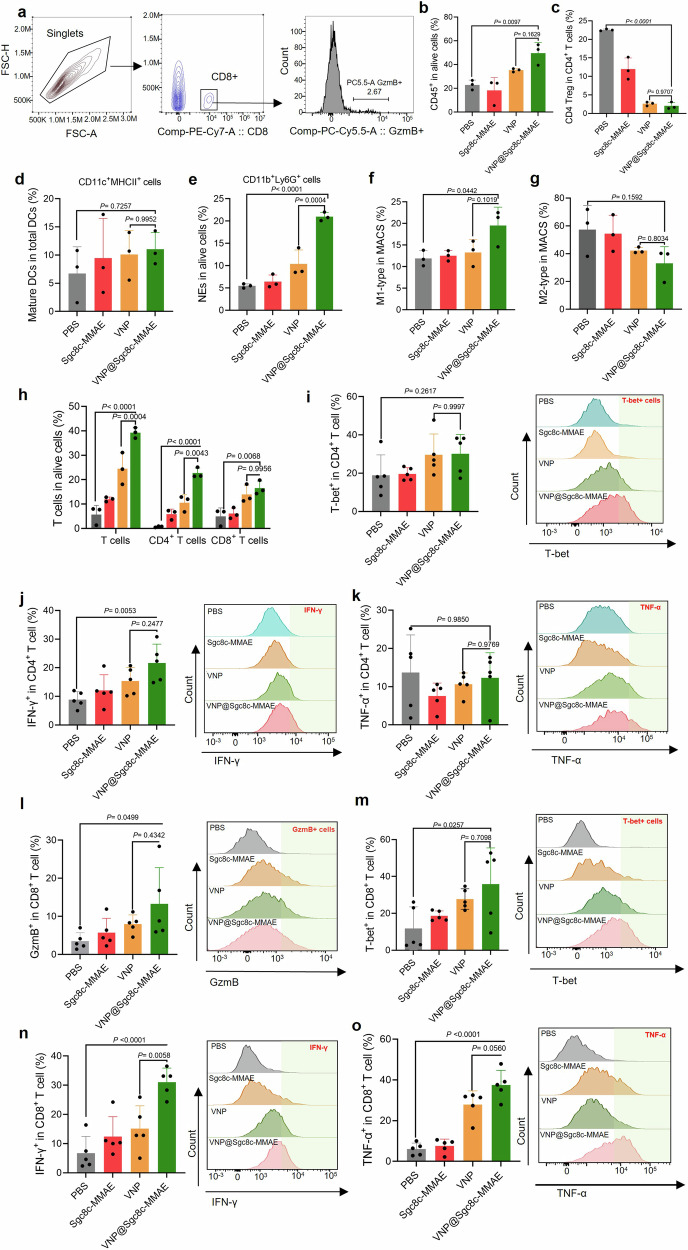
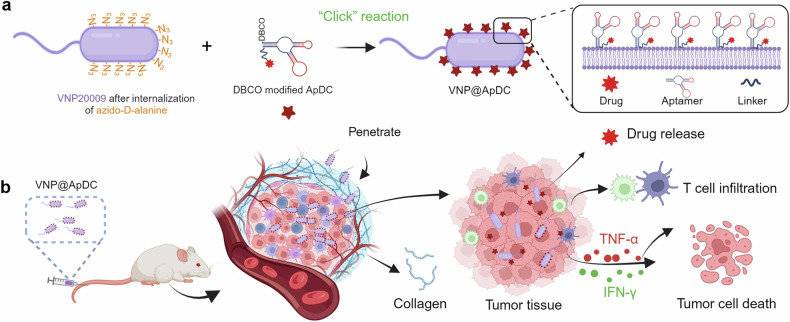
Pancreatic cancer is one of the most malignant tumors with the highest mortality rates, and it currently lacks effective drugs. Aptamer-drug conjugates (ApDC), as a form of nucleic acid drug, show great potential in cancer therapy. However, the instability of nucleic acid-based drugs in vivo and the avascularity of pancreatic cancer with dense stroma have limited their application. Fortunately, VNP20009, a genetically modified strain of Salmonella typhimurium, which has a preference for anaerobic environments, but is toxic and lacks specificity, can potentially serve as a delivery vehicle for ApDC. Here, we propose a synergistic therapy approach that combines the penetrative capability of bacteria with the targeting and toxic effects of ApDC by conjugating ApDC to VNP20009 through straightforward, one-step click chemistry. With this strategy, bacteria specifically target pancreatic cancer through anaerobic chemotaxis and subsequently adhere to tumor cells driven by the aptamer's specific binding. Results indicate that this method prolongs the serum stability of ApDC up to 48 h and resulted in increased drug concentration at tumor sites compared to the free drugs group. Moreover, the aptamer's targeted binding to cancer cells tripled bacterial colonization at the tumor site, leading to increased death of tumor cells and T cell infiltration. Notably, by integrating chemotherapy and immunotherapy, the effectiveness of the treatment is significantly enhanced, showing consistent results across various animal models. Overall, this strategy takes advantage of bacteria and ApDC and thus presents an effective synergistic strategy for pancreatic cancer treatment.


Conflict of interest statement

The authors declare no competing interests.

Figures

Fig. 1
Fig. 1
Construction of functionalized VNP@Sgc8c-MMAE. a Laser scanning confocal microscopy images of VNP@Sgc8c, VNP@Sgc8c-MMAE and VNP+Sgc8c-MMAE. Green and violet channels represent VNPGFP and Cy5-labeled Sgc8c or Sgc8c-MMAE, respectively. Scale bar: 10 μm. b Flow cytometric analysis of fluorescence intensity in VNP20009 after 4 h of incubation with D-Azidoalanine and subsequently anchored with Cy5-labeled Sgc8c or Sgc8c-MMAE. c Zeta potentials of native VNP20009 and its surface-modified variants: VNP-N3, VNP@Sgc8c and VNP@Sgc8c-MMAE. One-way ANOVA analysis followed by Fisher’s LSD multiple comparison. d Degradation kinetics of Cy5-labeled Sgc8c-MMAE on VNP20009 exposed to PBS solution containing 20% fetal bovine serum at 37 °C. e Representative digital images of agar plates and corresponding colony counts of VNP and VNP@Sgc8c-MMAE after 12 h of culture in LB medium, followed by plating on LB agar. f Growth curves of native VNP20009 and VNP@Sgc8c-MMAE cultured in LB liquid medium. OD600 was recorded at 1 h intervals by microplate reader. Data are presented as mean ± s.d. (n = 3), with statistical significance assessed by two-tailed t test
Fig. 2
Fig. 2
Targeting effect and cytotoxicity of functionalized VNP@Sgc8c-MMAE to pancreatic cancer cell lines. a LSCM images of Miapaca-2 pancreatic cancer cells incubated with 107 CFU VNP20009 or VNP@Sgc8c-MMAE for 2 h at 37 °C. Cells were rinsed with DPBS three times before observation. Green and red channels respectively show VNPGFP and Cy5-labeled Sgc8c-MMAE anchored on VNPGFP. Scale bar: 10 μm. b LSCM images and c quantification of cell death of pancreatic cancer cells stained with Hochest33342 (cell nuclei blue), Yopro-1 (apoptosis cells, green) and PI (necrosis cells, red) after incubation with VNP20009, Sgc8c-MMAE, Vc-MMAE or VNP@Sgc8c-MMAE at equal Vc-MMAE concentration (64 nM) for 48 h. Scale bar: 50 μm. d Viability of Panc-1, Miapaca-2, KPC1199 cells treated with VNP20009, Sgc8c-MMAE, Vc-MMAE or VNP@Sgc8c-MMAE at equal Vc-MMAE concentration (from 1 to 256 nM) for 72 h. VNP20009 concentration: 107 CFU. Data are shown as mean ± s.d. of three independent experiments. Two-way ANOVA analysis followed by Fisher’s LSD multiple comparison
Fig. 3
Fig. 3
Targeting enrichment of VNP@Sgc8c-MMAE at tumor site. a IVIS imaging of Miapaca-2 tumor-bearing mice at 24, 48 and 72 h after i.v. injection with 107 CFUs of native Lux-engineered VNP, VNP@Lib-MMAE or VNP@Sgc8c-MMAE (n = 3 mice per group). b Average intensity of luminescent signals from circled tumor region (orange) at 24, 48 and 72 h calculated by IVIS Lumina II system. c Ex vivo IVIS Lumina imaging and df average luminescence intensity in tumor and major organs of Miapaca-2 tumor-bearing mice from 24 h to 72 h after i.v. injection with Lux-engineered VNP, VNP@Lib-MMAE or VNP@Sgc8c-MMAE. Bacterial counts of (g) VNP@Sgc8c-MMAE, h VNP@Lib-MMAE and i VNP in tumor and major tissues from 24 h to 72 h after first treatment. Data are presented as mean ± s.d. (n = 3 mice per group, two-way ANOVA analysis followed by Fisher’s LSD multiple comparison
Fig. 4
Fig. 4
Multifaceted analysis of immune response and drug delivery in pancreatic cancer tissues. a Confocal images of tumor tissue sections collected from KPC1199 subcutaneous tumor-bearing mouse at 24 h and 48 h post-intravenous injection of 107 CFU VNP@Sgc8c-MMAE-Cy5. VNPGFP is depicted in green, nuclei stained with DAPI are shown in blue, and Cy5-labeled Sgc8c-MMAE appear in red. Scale bar: 500 μm. b Quantification of payload penetration. The green represents VNPGFP, and the red represents Cy5-labeled Sgc8c-MMAE. c Representative confocal images depicting immune cell infiltration in KPC1199 subcutaneous pancreatic tumor tissues after intravenous administration of Sgc8c-MMAE or VNP@Sgc8c-MMAE. The orange box marks the area selected for obtaining the high-magnification field (HMF) image. d Representative confocal images of immune cells in tumor tissue of a pancreatic cancer in-situ carcinoma model. Scale bar: 20 μm. Blue indicates cell nuclei stained with DAPI, green represents CD3 immune cells, purple highlights CD8+ T cells, and red signifies CD4+ T cells. e Quantitative analysis of CD4+CD3+ T cells and CD8+ CD3+ T cells within the tumor based on cell counts in each high-magnification field within both tumor and adjacent non-tumor regions. Analysis conducted on five representative fields per section using ImageJ software. Results are presented as mean ± standard error of the mean (one-way ANOVA analysis, followed by Fisher’s LSD multiple comparison)
Fig. 5
Fig. 5
In vivo therapeutic efficacy in KPC1199 subcutaneous pancreatic tumor model. a The change of tumor volume as a function of time after different treatments (n = 8). b Fluctuation of body weight after treatment (n = 8). c Tumor weight of different treatments on the day of sacrifice. d Representative digital photo of tumor tissues harvested from C57 mice on the day of sacrifice. Flow cytometric analysis of the population of e CD4+ and f CD8+ T cells gated on CD3+ T cells within tumor tissues (n = 3). g Quantification of TNF-α, IFN-γ and IL-6 in tumor tissue lysate and plasma of KPC1199-bearing C57 mice at the end of treatment. Data are shown as mean ± s.d. One-way ANOVA analysis followed by Fisher’s LSD multiple comparison
Fig. 6
Fig. 6
In vivo therapeutic efficacy in a PDX model. a PDX model construction and treatment flowchart. Image created with Biorender.com, with permission. b Tumor volume variation over time following various treatments (n = 5). Results are presented as the mean ± s.d. from five separate trials. Utilizing a one-way ANOVA followed by Fisher’s LSD multiple comparison, significance values were determined as follows: P = 0.1138 for PBS vs. VNP@Sgc8c-MMAE and P = 0.7928 for VNP@Sgc8c-MMAE vs. VNP+Sgc8c-MMAE. c Representative images of tumor samples from mice taken post-treatment. Scale bar: 1 cm. d Body weight changes post-treatment (n = 5). e Tumor weights on the termination day across different treatments. f H&E, Ki67 and TUNEL (green) analysis of tumor samples. Scale bar: 100 μm
Fig. 7
Fig. 7
In vivo therapeutic efficacy in an in-situ carcinoma model. a Diagram illustrating the setup and treatment protocol of the in-situ carcinoma model of pancreatic cancer. Image created with Biorender.com, with permission. b Characteristic images of tumor tissues extracted from mice after treatment interventions. Scale bar: 1 cm. c Alterations in overall tumor flux as a function of time across distinct therapeutic strategies (n = 5). Data are depicted as mean ± s.d. from five independent experiments. d Luminescence intensity variations in pancreatic tumors of mice monitored using a live imaging system. e Recorded tumor masses at the study’s conclusion for each treatment group. f Body weight fluctuations observed post-treatment interventions (n = 5). g Tumor sections from the VNP@Sgc8c-MMAE group were analyzed using H&E, TUNEL (green) stains, and T cell stains. Cell nuclei were stained with DAPI (blue), CD3+ immune cells were stained with GFP-labeled anti-CD3 antibody (Green), and CD4+ immune cells were stained with APC-labeled anti-CD4 antibody (Red). CD8+ immune cells were stained with PI-labeled anti-CD8 antibody (Purple). Scale bar: 1000 μm (top) and 50 μm (bottom). The white box in the top image represents the area shown in the bottom image. h Survival curves for mice treated with PBS, Sgc8c-MMAE, VNP, and VNP@Sgc8c-MMAE. Cytokine levels in plasma of treated mice: i TNF-α, j IFN-γ, k CCL5. Statistical analysis was carried out using one-way ANOVA succeeded by Fisher’s LSD post-hoc test
Fig. 8
Fig. 8
VNP@Sgc8c-MMAE activates antitumor immunity. a Gating strategy for flow cytometry analysis of immune cells, highlighting singlets, CD8+ cells, and GzmB+ cells. b Percentage of CD45+ immune cells in tumors after different treatments. c Percentage of CD4+ T regulatory (Treg) cells (CD25+CD127-) in the CD4+ T cell population in tumors after different treatments. The VNP@Sgc8c-MMAE group shows a significant decrease in CD4+ Treg cells compared to the PBS control. Analysis of various immune cell populations, including d mature dendritic cells (CD11c+MHCII+), e neutrophils (CD11b+Ly6G+), f M1-type macrophages, and g M2-type macrophages, with VNP@Sgc8c-MMAE treatment showing significant increases in M1-type macrophages and decreases in M2-type macrophages. h Proportion of total T cells, CD4+ T cells, and CD8+ T cells in live cell populations, demonstrating significant increases in T cell infiltration in the VNP@Sgc8c-MMAE group. i T-bet expression in CD4+ T cells, indicating Th1 differentiation. J, K IFN-γ and TNF-α production in CD4+ T cells, with significant upregulation in the VNP@Sgc8c-MMAE group. l, m Granzyme B (GzmB) and T-bet expression in CD8+ T cells, showing enhanced cytotoxic activity and Th1 differentiation. n, o IFN-γ and TNF-α production in CD8+ T cells, indicating enhanced immune responses in the VNP@Sgc8c-MMAE group. Data are presented as the mean ± s.d. (n = 3–5)
Fig. 9
Fig. 9
Schematic illustrating the construction of functionalized bacteria and the mechanism against pancreatic tumors. a Preparation of ApDC-anchored VNP20009 via a simple one-step click chemistry process. b Drug-loaded bacteria penetrate the stromal barriers of pancreatic neoplasms after intravenous (i.v.) administration, effectuating deep-tissue drug release. Concurrently, they secrete cytokines, triggering both apoptosis and necrosis in malignant cells, while amplifying the recruitment of immune cells to the tumor site. Image created with Biorender.com, with permission

References

    1. Bazeed, A. Y., Day, C. M. & Garg, S. Pancreatic cancer: challenges and opportunities in locoregional therapies. Cancers14, 4257 (2022). - PMC - PubMed
    1. Springfeld, C. et al. Neoadjuvant therapy for pancreatic cancer. Nat. Rev. Clin. Oncol.20, 318–337 (2023). - PubMed
    1. Shaib, W. L. et al. Phase II randomised, double-blind study of mFOLFIRINOX plus ramucirumab versus mFOLFIRINOX plus placebo in advanced pancreatic cancer patients (HCRN GI14-198). Eur. J. Cancer.189, 112847 (2023). - PubMed
    1. Schlick, K. et al. Comparison of gemcitabine plus oxaliplatin versus gemcitabine plus nab‐paclitaxel as first‐line chemotherapy for advanced pancreatic adenocarcinoma: a single‐center retrospective analysis. Cancer Med.12, 16997–17004 (2023). - PMC - PubMed
    1. Yin, C., Alqahtani, A. & Noel, M. S. The next frontier in pancreatic cancer: targeting the tumor immune milieu and molecular pathways. Cancers14, 2619 (2022). - PMC - PubMed

Publication types

MeSH terms

Substances