

Effects of vitamin D supplementation on serum 25(OH)D3 levels and neurobehavioral development in premature infants after birth
- PMID: 39397102
- PMCID: PMC11471846
- DOI: 10.1038/s41598-024-75191-w
Effects of vitamin D supplementation on serum 25(OH)D3 levels and neurobehavioral development in premature infants after birth
Abstract
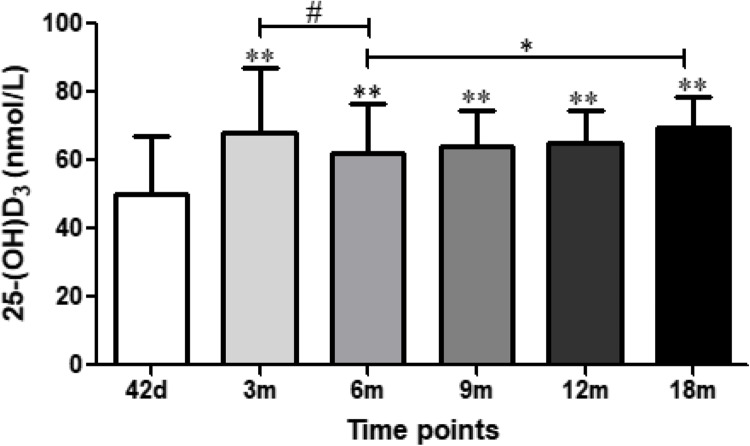
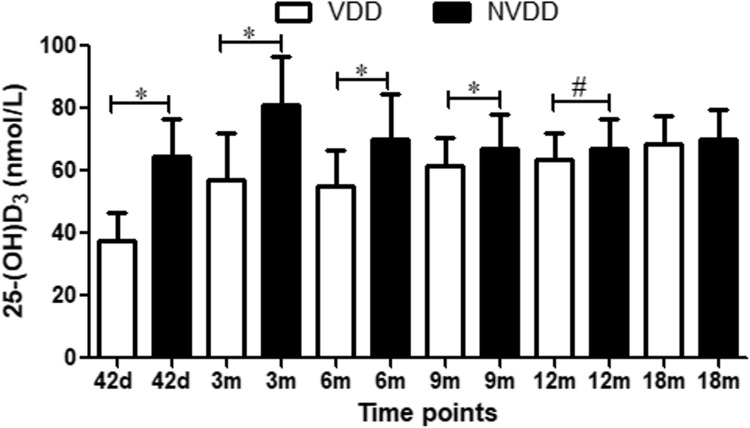
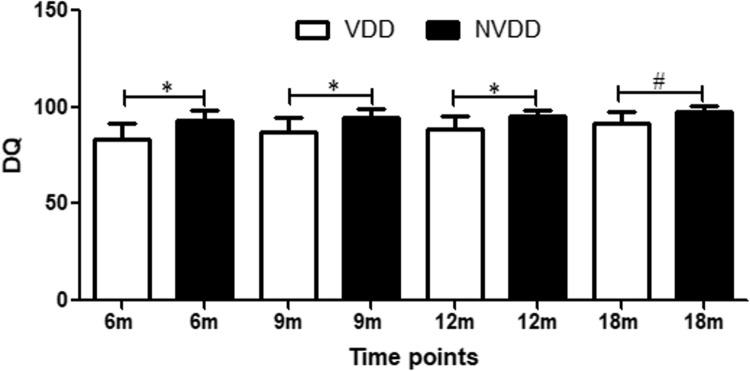
This study explored the factors influencing serum 25(OH)D3 levels and the effects of Vitamin D deficiency (VDD) and VD supplementation on 25(OH)D3 levels and neuropsychobehavioral development in premature infants, to provide a theoretical basis for improving their prognosis. Physical examination, neuropsychobehavioral development and serum 25(OH)D3 levels were assessed regularly in 158 preterm infants supplemented with VD formulation. 25(OH)D3 levels were analyzed at 3, 6, 9, 12, and 18 months after birth. The Gesell neuropsychological development test was conducted at 6, 9, 12, and 18 months after birth to obtain the developmental quotient (DQ). Based on the serum 25(OH)D3 levels at 42 days of age, the infants were divided into VDD and non-VDD groups. Preterm infants in the VDD group were supplemented with more VD until their 25(OH)D3 levels were normal, and were divided into sustained VDD (SVDD) and corrected VDD (CVDD) groups according to serum 25(OH)D3 levels at 3 months of age. Appropriate statistical methods were chosen to compare differences in 25(OH)D3 and DQ between or among different groups, screen for the factors influencing 25(OH)D3 levels in preterm infants at 42 days of age, and analyze the relationship between 25(OH)D3 and DQ. The 25(OH)D3 levels of preterm infants at 42 days of age were positively correlated with VD supplementation during pregnancy, and before 42 days after birth (P < 0.05). The 25(OH)D3 levels in preterm infants at 42 days and 3 months of age were positively correlated with the DQ levels at 6, 9, 12, and 18 months of age (P < 0.05). The DQ level in the VDD group, especially SVDD group, was lower than that in CVDD and non-VDD groups at the same time point (P < 0.05). This research thus demonstrates that VD supplementations during pregnancy and after birth is a major factor affecting 25(OH)D3 levels in premature infants. Early VDD and SVDD can affect their neuropsychobehavioral development, and effective VD supplementation can gradually correct VDD and mitigate this influence.
Keywords: 25(OH)D3; Neuropsychobehavioral development; Premature infants; Vitamin D; Vitamin D deficiency.
© 2024. The Author(s).
Conflict of interest statement
The authors declare no competing interests.
Figures


References
MeSH terms
Substances
LinkOut - more resources
Full Text Sources
Medical
