. 2024 Dec;133(6):437-449.
doi: 10.1038/s41437-024-00728-8. Epub 2024 Oct 13.

Too big to purge: persistence of deleterious Mutations in Island populations of the European Barn Owl (Tyto alba)

Affiliations

Too big to purge: persistence of deleterious Mutations in Island populations of the European Barn Owl (Tyto alba)

Eléonore Lavanchy et al. Heredity (Edinb). 2024 Dec.

Abstract

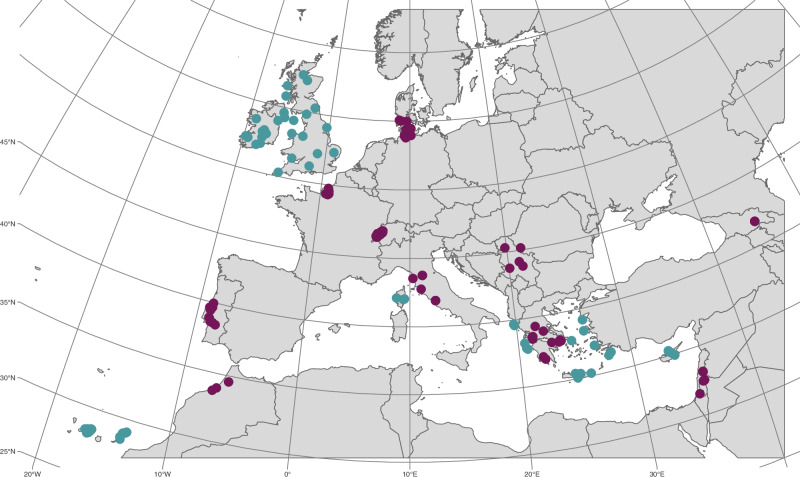
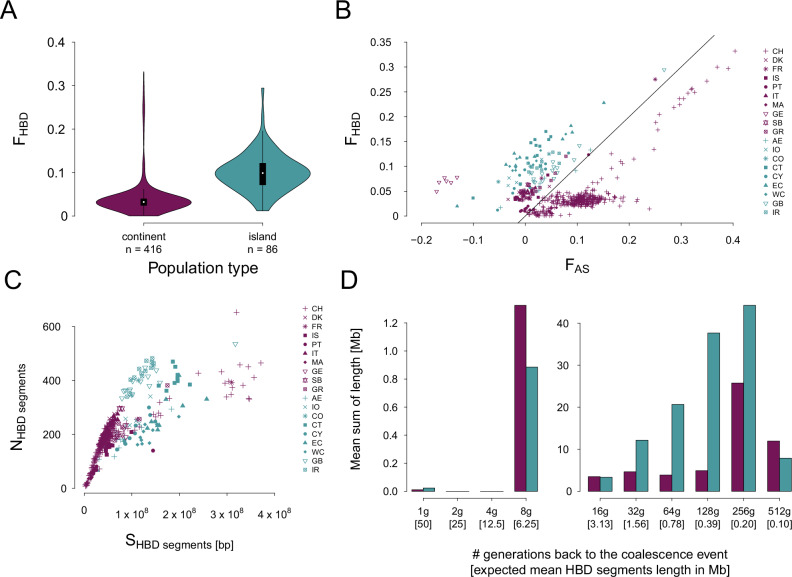
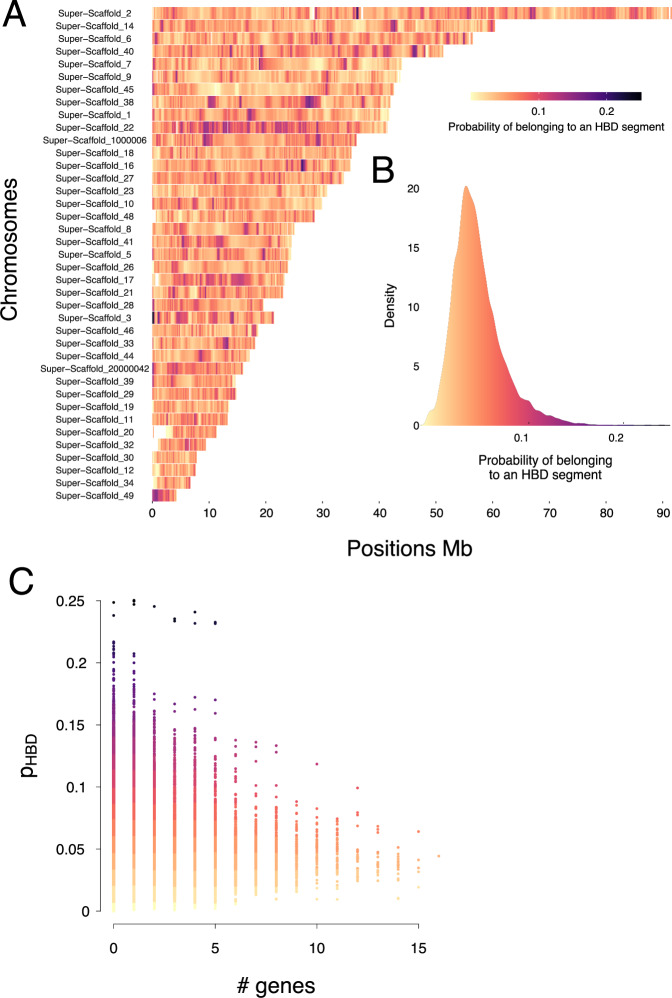
A key aspect of assessing the risk of extinction/extirpation for a particular wild species or population is the status of inbreeding, but the origin of inbreeding and the current mutational load are also two crucial factors to consider when determining survival probability of a population. In this study, we used samples from 502 barn owls from continental and island populations across Europe, with the aim of quantifying and comparing the level of inbreeding between populations with differing demographic histories. In addition to comparing inbreeding status, we determined whether inbreeding is due to non-random mating or high co-ancestry within the population. We show that islands have higher levels of inbreeding than continental populations, and that this is mainly due to small effective population sizes rather than recent consanguineous mating. We assess the probability that a region is autozygous along the genome and show that this probability decreased as the number of genes present in that region increased. Finally, we looked for evidence of reduced selection efficiency and purging in island populations. Among island populations, we found an increase in numbers of both neutral and deleterious minor alleles, possibly as a result of drift and decreased selection efficiency but we found no evidence of purging.


Conflict of interest statement

Competing interests: The authors declare no competing interests.

Figures

Fig. 1
Fig. 1. Map of samples’ locations.
Continental samples are shown in purple and island samples in blue.
Fig. 2
Fig. 2. Inbreeding difference between mainland and island populations.
For all panels, continental populations are shown in purple and island populations in blue. A FHBD distributions from continental and island populations. FHBD considers a marker as autozygous if the coalescence event is up to 512 generations ago. B scatter plot of FHBD against FAS. Each point represents one individual and its shape indicates which population it comes from. The black line is the identity line (x = y). C number of HBD segments (NHBD) as a function of the mean length of HBD segments (SHBD) in base-pair. Each point represents one individual and its shape indicates which population it comes from. D HBD segments distributions from continental populations and island populations. The y-axis represents the mean sum of length (among individuals) falling into the different categories of HBD segments (represented in the x-axis).
Fig. 3
Fig. 3. Quantification of the probability to belong to an HBD segment along the genome.
A Probability to belong to an HBD segment coalescing less than 512 generations ago along the different super-scaffolds. Probabilities were estimated via overlapping 100 kb windows with a 20 kb sliding step. Blank spaces correspond to windows where no SNPs were present. B Density of probability to belong to an HBD segment, all super-scaffolds included. The code to create this figure was obtained from M. Stoffel GitHub. C Probability that a 100 Kb window is HBD according to the number of genes in this window.
Fig. 4
Fig. 4. Distribution of minor alleles in continental versus islands populations according to their deleterious effects.
Minor allele effects were classified with SnpEff. A Count of neutral minor alleles. B Count of lowly deleterious minor alleles. C Count of moderately deleterious minor alleles. D Count of highly deleterious minor. E RXY Ratio of minor alleles in continental populations to island populations scaled by the same ratio for SNPs located in intergenic regions. RXY < 1 indicates that insular populations are more enriched in minor alleles of the focal category compared to their enrichment for neutral intergenic alleles. On the contrary, RXY > 1 indicates that insular populations are depleted in minor alleles of the focal category compared to their enrichment for intergenic alleles. F Count of homozygous neutral minor alleles. G Count of homozygous lowly deleterious minor alleles. H Count of homozygous moderately deleterious minor alleles. I Count of homozygous highly deleterious minor alleles. J RXY2 ratio of minor alleles in continental populations compared to island populations. RXY2 < 1 indicates that insular populations are more enriched in homozygous minor alleles of the focal category compared to their enrichment for neutral homozygous intergenic alleles. On the contrary, RXY2 > 1 indicates that insular populations are depleted in homozygous minor alleles of the focal category compared to their enrichment for homozygous intergenic alleles. For violin plots, continental populations are shown in purple and island populations in blue.
Fig. 5
Fig. 5. Distribution (among individuals) of minor alleles in continental refugium populations versus recolonized (after the last glacial maximum) populations.
Minor allele effects were estimated with SnpEff. A Count of neutral minor alleles. B Count of lowly deleterious minor alleles. C Count of moderately deleterious minor alleles. D Count of highly deleterious minor alleles. E RXY Ratio of minor alleles in refugium populations compared to recolonized populations. RXY < 1 indicates that recolonized populations are enriched in minor alleles of the focal category compared to their enrichment for supposedly neutral intron alleles. On the contrary, RXY > 1 indicates that recolonized populations are more depleted in minor alleles of the focal category compared to their enrichment for intron alleles. F Count of homozygous neutral minor alleles. G Count of homozygous lowly deleterious minor alleles. H Count of homozygous moderately deleterious minor alleles. I Count of homozygous highly deleterious minor alleles. J RXY2 ratio of minor alleles in refugium populations compared to recolonized populations compared to the baseline enrichment for supposedly neutral intron alleles. RXY2 < 1 indicates that recolonized populations are enriched in homozygous minor alleles of the focal category compared to their enrichment in homozygous intron alleles. On the contrary, RXY2 > 1 indicates that recolonized populations are more depleted in homozygous minor alleles of the focal category compared to their enrichment in homozygous intron alleles. For violin plots, refugium populations are shown in pink and recolonized populations in light blue.

Similar articles

References

    1. Antoniazza S, Burri R, Fumagalli L, Goudet J, Roulin A (2010) Local adaptation maintains clinal variation in melanin-based coloration of European Barn Owls (Tyto Alba). Evolution 64:1944–1954 - PubMed
    1. Bertrand AR, Kadri NK, Flori L, Gautier M, Druet T (2019) RZooRoH: an R package to characterize individual genomic autozygosity and identify homozygous-by-descent segments. Methods Ecol Evol 10:860–866
    1. Béziers P, Roulin A (2021) Sexual maturity varies with melanic plumage traits in the barn owl. J Avian Biol 52:jav.02715
    1. Bolger AM, Lohse M, Usdel B (2014) Trimmomatic: a flexible trimmer for Illumina sequence data. Bioinformatics 30:2114–2120 - PMC - PubMed
    1. Browning BL, Browning SR (2011) A fast, powerful method for detecting identity by descent. Am J Hum Genet 88:173–182 - PMC - PubMed

LinkOut - more resources