. 2024 Oct 14;14(1):23959.
doi: 10.1038/s41598-024-74738-1.

Optimization of microwave parameters to enhance phytochemicals, antioxidants and metabolite profile of de-oiled rice bran

Affiliations

Optimization of microwave parameters to enhance phytochemicals, antioxidants and metabolite profile of de-oiled rice bran

Alonkrita Chowdhury et al. Sci Rep. .

Erratum in

Abstract

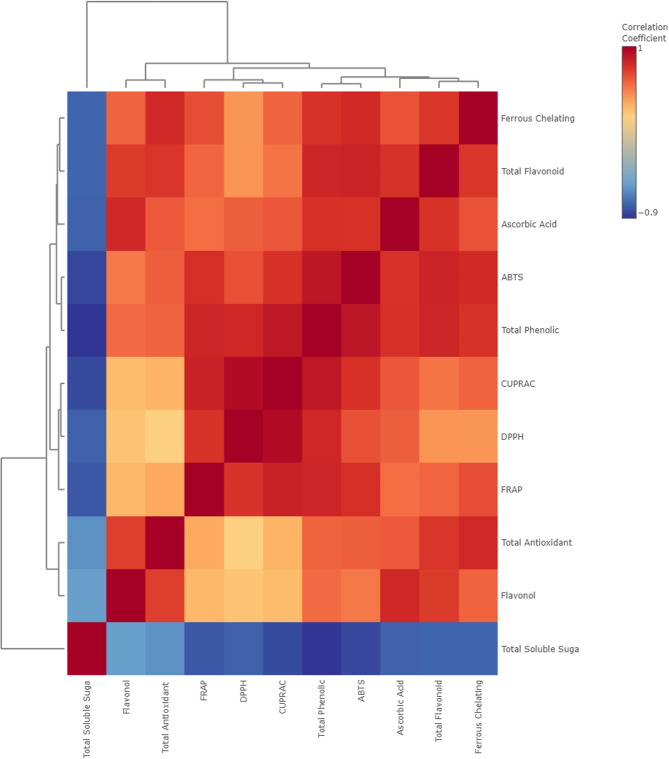
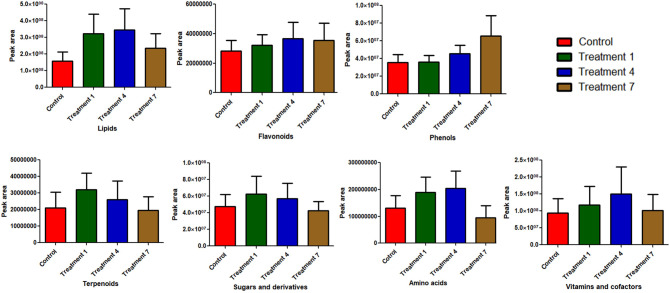
The current study explores the effects of microwave treatment at varying wattage and durations on the phytoconstituents, antioxidant status, anti-nutritional factors (ANFs), and metabolite profiles of de-oiled rice bran. The total phenolics and flavonoids showed both increases and decreases depending on specific microwave parameters, while flavonol content consistently increased across all treated groups compared to the control. The DPPH and ABTS free radical scavenging activity, total antioxidant capacity, FRAP, CUPRAC, metal chelating activity, and ascorbic acid content were enhanced in most of the microwaved samples; however, longer microwave exposure at higher wattage led to their reduction. A treatment-specific decrease in ANFs, including condensed tannins, oxalates, and phytates, was observed. HRMS-based untargeted metabolomics identified a diverse range of primary and secondary metabolites, which clustered in a group-specific manner, indicating notable group-wise metabolite variations. Analysis of discriminating metabolites revealed no significant differences in the overall levels of phenolics, flavonoids, vitamins and cofactors, sugars, amino acids, terpenoids, fatty acids, and their derivatives among the treated groups compared to the control; however, several individual metabolites within these metabolite classes differed significantly. These findings suggest that optimized microwaving of de-oiled rice bran can enhance phytochemicals and antioxidants while improving the metabolite profile.

Keywords: Antioxidants; De-oiled rice bran; High-resolution mass spectrometry (HRMS); Metabolomics; Microwave; Phytoconstituents.


Conflict of interest statement

The authors declare no competing interests.

Figures

Fig. 1
Fig. 1
Box-Whisker plot depicting different concentrations of phytochemicals and total soluble sugar content between control and microwave-treated DORB samples: (a) Total phenolic content (b) Total flavonoid content, (c) Flavonol content, and (d) Total soluble sugar content.
Fig. 2
Fig. 2
Box-Whisker plot representing the antioxidant status of the control and microwave-treated DORB samples: (a) DPPH free radical scavenging activity (b) ABTS free radical scavenging activity, (c) Total antioxidant capacity, (d) Ferric reducing antioxidant power, (e) Cupric reducing antioxidant capacity, (f) Ferrous ion chelating activity, (g) Ascorbic acid content.
Fig. 3
Fig. 3
Correlation analysis between the phytochemicals and antioxidants: the heat map of the different parameters generated by using the MetaboAnalyst 6.0 program (https://new.metaboanalyst.ca) portrays high to low correlation on the basis of correlation coefficient ranging from − 0.9 to 1. Shades of red color represent high correlation whereas the blue colors denote lowly correlated parameters.
Fig. 4
Fig. 4
Box-Whisker plot signifying different concentrations of anti-nutritional factors between control and microwave-treated DORB samples: (a) Condensed Tannin Content, (b) Oxalate content, and (c) Phytate content.
Fig. 5
Fig. 5
Volcano plot denotes the univariate analysis of significantly different (p < 0.05) metabolites obtained through one-way ANOVA and Post-hoc analysis (Fisher’s LSD). The X-axis and Y-axis represent Fold Change (log2FC) and T-test (-log10 p-value) respectively. Shades of red represent significant upregulations whereas the blue shades symbolize significant downregulations. The alterations in metabolites between different treatments and control group have been graphically represented through volcano plot as (a) T-1 vs. control group, (b) T-4 vs. control group, and (c) T-7 vs. control group.
Fig. 6
Fig. 6
(a) PCA synchronized 3D plot employing PC1 (51.3%), PC2 (22.5%), and PC3 (17.6%) represents groupwise distinct clusters signifying intrinsic variation in the metabolite data set and similarities in variables. (b) The 2D score plot of sPLS-DA analysis incorporating Component 1 (40%) and Component 2 (25.9%) yielded segregated clusters of control and different treatment groups maximizing the class discrimination. (c) Loading plots of sPLS-DA analysis represents the top ten metabolites with the highest loading weights in the first component. (d) The hierarchical clustering analysis of metabolites from control and treated groups depicted in the heat map represents that samples from the same group lied together while different group-specific samples orient them in distant clads in the dendrogram. The heat map was generated by using the MetaboAnalyst 6.0 program (https://new.metaboanalyst.ca).
Fig. 7
Fig. 7
The score plot of the OPLS-DA analysis between control and different treated groups represents prominent variations in differential metabolites (VIP values ≥ 1, ≥ 1 log2FC ≤ -1 and P-value < 0.05). (a) Score plot for T-1 vs. control group where X-axis and Y-axis represents T score (68.9%) and orthogonal T score (9%) respectively, (b) Score plot for T-4 vs. control group where X-axis and Y-axis represents T score (65.8%) and orthogonal T score (8.6%) respectively, (c) Score plot for T-7 vs. control group where X-axis and Y-axis represents T score (63.6%) and orthogonal T score (10%) respectively.
Fig. 8
Fig. 8
Venn diagram analysis of discriminating metabolites based on OPLS-DA derived VIP values ≥ 1, ≥ 1 log2FC ≤ -1 and P-value < 0.05 depicting coinciding metabolites in different treatment. (a) Common upregulated metabolites in all the treated groups with respect to the control, (b) common downregulated metabolites in all the treated groups with respect to the control.
Fig. 9
Fig. 9
One-way ANOVA analysis illustrates metabolic content in different treated groups with respect to the control using P-value cut off < 0.05 and Dunnett’s Multiple Comparison Post Test through GraphPad Prism 5.01.
Fig. 10
Fig. 10
Two-way ANOVA analysis using GraphPad Prism 5.01 depicting significant (p < 0.05) group-wise difference in major discriminating metabolites. Abundance of individual metabolites differed significantly between the groups are expressed by using different superscript letters (a–d).

Similar articles

Cited by

References

    1. Zarei, I., Brown, D. G., Nealon, N. J. & Ryan, E. P. Rice bran metabolome contains amino acids, vitamins & cofactors, and phytochemicals with medicinal and nutritional properties. Rice10(1), 24. 10.1186/s12284-017-0157-2 (2017). - PMC - PubMed
    1. Huang, B. et al. Available energy and amino acid digestibility of defatted rice bran fed to growing pigs. J. Anim. Sci.96(8), 3138–3150. 10.1093/jas/sky191 (2018). - PMC - PubMed
    1. Azrinnahar, M., Islam, N., Shuvo, A. A. S., Kabir, A. K. M. A. & Islam, K. M. S. Effect of feeding fermented (Saccharomyces cerevisiae) de-oiled rice bran in broiler growth and bone mineralization. J. Saudi Soc. Agric. Sci.20(7), 476–481. 10.1016/j.jssas.2021.05.006 (2021).
    1. Sunphorka, S., Chavasiri, W., Oshima, Y. & Ngamprasertsith, S. Protein and sugar extraction from rice bran and de-oiled rice bran using subcritical water in a semi-continuous reactor: Optimization by response surface methodology. Int. J. Food Eng.8(3). 10.1515/1556-3758.226 (2012).
    1. Ranjan, A., Kumar, S., Sahu, N. P., Jain, K. K. & Deo, A. D. Strategies for maximizing utilization of de-oiled rice bran (DORB) in the fish feed. Aquac. Int.30(1), 99–114. 10.1007/s10499-021-00791-6 (2022).