. 2024 Oct 13;14(1):23914.
doi: 10.1038/s41598-024-74734-5.

Deciphering the intracellular forces shaping mitochondrial motion

Affiliations

Deciphering the intracellular forces shaping mitochondrial motion

Agustina Belén Fernández Casafuz et al. Sci Rep. .

Abstract

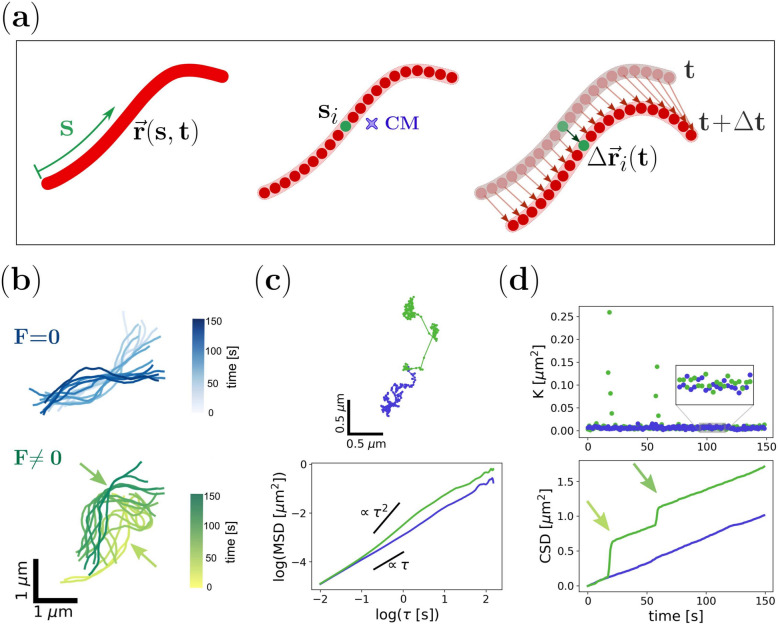
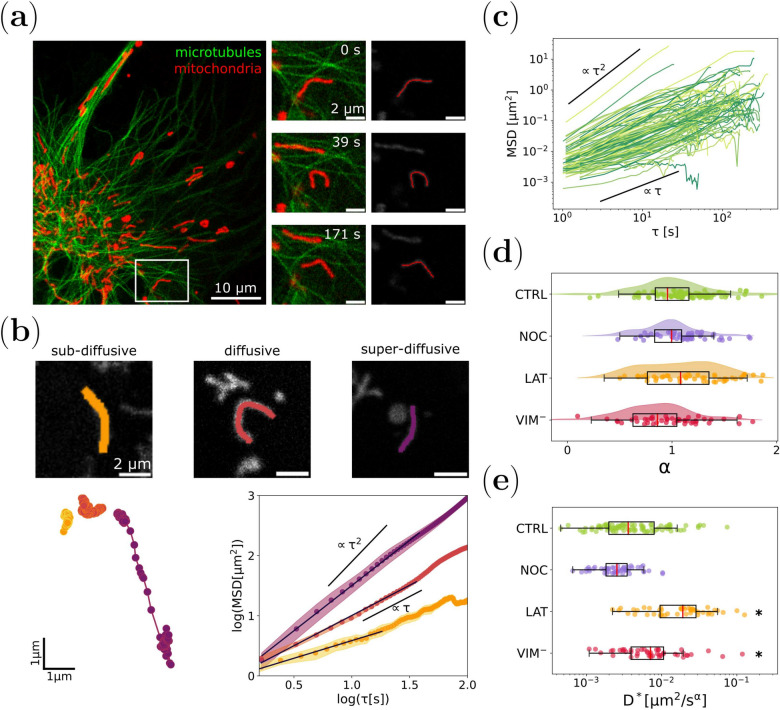
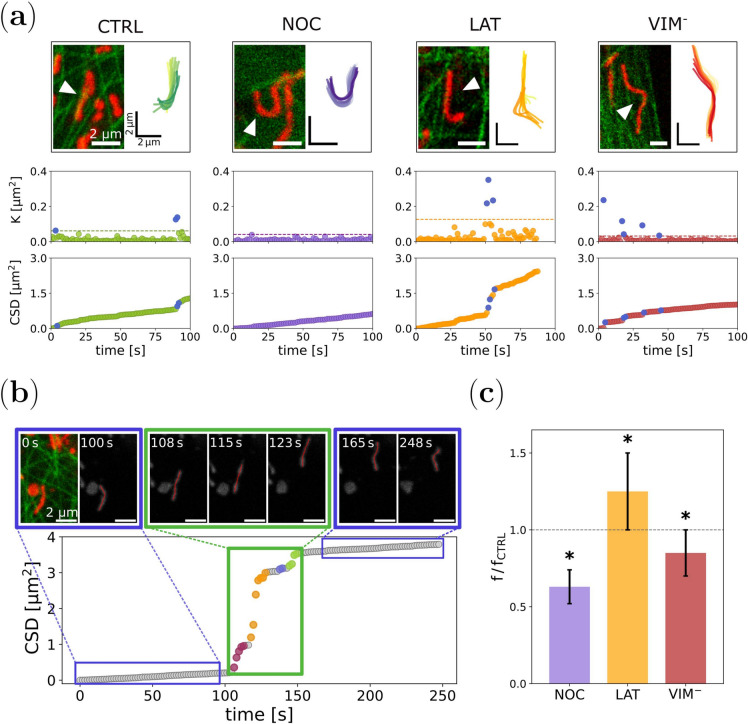
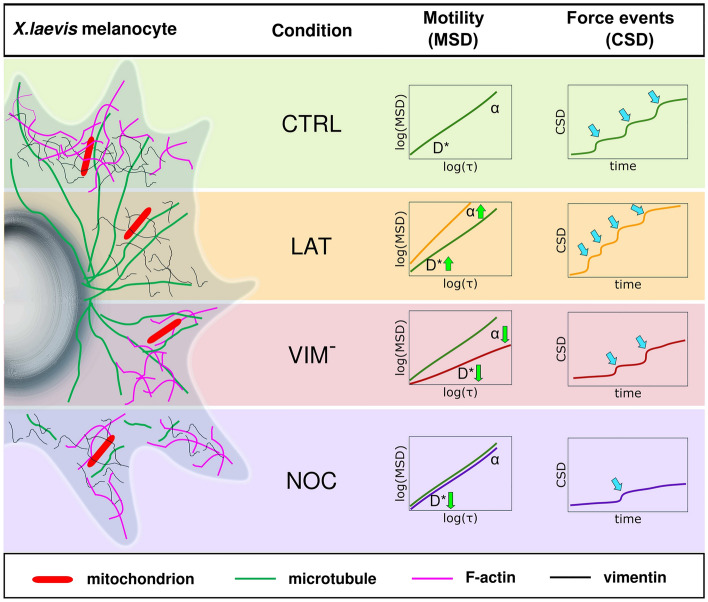
We propose a novel quantitative method to explore the forces affecting mitochondria within living cells in an almost non-invasive fashion. This new tool enables the detection of localized mechanical impulses on these organelles that occur amidst the stationary fluctuations caused by the thermal jittering in the cytoplasm. Recent experimental evidence shows that the action of mechanical forces has important effects on the dynamics, morphology and distribution of mitochondria in cells. In particular, their crosstalk with the cytoskeleton has been found to alter these organelles function; however, the mechanisms underlying this phenomenon are largely unknown. Our results highlight the different functions that cytoskeletal networks play in shaping mitochondrial dynamics. This work presents a novel technique to extend our knowledge of how the impact of mechanical cues can be quantified at the single organelle level. Moreover, this approach can be expanded to the study of other organelles or biopolymers.


Conflict of interest statement

The authors declare no competing interests.

Figures

Fig. 1
Fig. 1
Physical modeling of mitochondria motion.(a) Representative scheme of a filamentous mitochondria characterized by its curvilinear shape. The organelle profile is described by the position (r) of a material point (s) registered at a certain time (t) at a distance s from its edge. Each discrete point or bead constituting the filament (si, green) was tracked to determine the trajectory of the center of mass (CM) and the displacement after a time lag Δt. (b) Temporal evolution of simulated semiflexible filaments in the absence (F=0, blue; top panel) or presence (F0, green; bottom panel) of active forces. The arrows indicate the points of force application at different times. (c) Trajectories of the CM corresponding to the filaments shown in (b) and dependence of the MSD with τ for each of them (top and bottom panel, respectively). (d) Temporal evolution of K values and the CSD obtained for the filaments indicated in (b). In the presence of active forces (green data set), K fluctuations over time exhibit outliers that correspond to the jumps (arrows) shown in the CSD graph coinciding with the time of force application.
Fig. 2
Fig. 2
Mitochondrial motion regimes depend on cytoskeleton integrity. (a) Representative confocal image of a X. laevis melanophore cell expressing EGFP-XTP (green: microtubules) and incubated with MitoTracker Deep Red FM (red: mitochondria). Time-lapse images of a mitochondrion (white square, left panel) and its respective track are shown in the right panel and Supplementary Video S1. (b) Mitochondrial motion regimes. Tracking of three mitochondria experiencing sub-diffusive (orange, α<1, Supplementary Video S2), diffusive (dark red, α1, Supplementary Video S3), and super-diffusive (purple, α>1, Supplementary Video S4) behavior (top panel). The trajectories of the CM corresponding to these organelles and the MSD dependence with τ for each of them are shown at the bottom panel. (c) MSD curves obtained for mitochondria within melanocytes in control condition (CTRL, N=89). (d) Distribution of α values registered for mitochondria in control cells (CTRL: green), cells treated with nocodazole (NOC: blue, partial depolymerization of microtubules, N=49) or latrunculin-B (LAT: orange, depolymerization of F-actin, N=48) and cells transfected with mCherry-vim(1-138) (VIM-: red, disruption of vimentin filaments, N=46). (e) Generalized diffusion coefficient (D) distribution obtained for each experimental condition. The asterisks denote significant differences (p-value < 0.05) with respect to CTRL.
Fig. 3
Fig. 3
Quantification of intracellular forces involved in mitochondrial dynamics. (a) Temporal evolution of the square displacements K and the CSD for mitochondria within X. laevis melanophore cells. For each experimental condition, mitochondria were tracked (top panels, Supplementary Videos S5-S8) to compute K values and the CSD dependence over time (bottom panels). The K outliers and the corresponding jumps at the CSD plots are shown in blue. (b) Correlation of the CSD jumps and the active forces exerted on mitochondria. Representative time-lapse images and tracking of a mitochondrion engaging in active transport (top panel, Supplementary Video S4). When the organelle undergoes a significant longitudinal displacement, a jump is recorded in the CSD graph (bottom panel). The color code at the jump indicates the number of different events detected by the algorithm. (c) Mean frequency of events obtained from the CSD analysis for each experimental condition relative to CTRL, calculated as explained in the text. Asterisks denote significant differences with CTRL.
Fig. 4
Fig. 4
Schematic representation of the different experimental conditions and the corresponding MSD and CSD analyses. Mitochondria within X. laevis melanocytes were analyzed under control conditions (CTRL) and after disrupting the cytoskeletal networks with different treatments: latrunculin-B (LAT) was used to disrupt F-actin; cells were transiently transfected with a dominant-negative vimentin mutant (mCherry-vim(1-138), VIM-); microtubules were partially depolymerized with nocodazole (NOC). Mean Square Displacement (MSD) analysis was fitted with an anomalous diffusion model that features α and D. On average, CTRL (green line) and NOC (violet line) conditions displayed a diffusive behavior (α1), while LAT (orange line) and VIM- (red line) showed superdiffusive (α>1) and subdiffusive (α<1) behaviors, respectively. Mitochondrial motility (D) increased in the absence of F-actin and was reduced in NOC and VIM- conditions. Green arrows indicate these tendencies. We detected the number of force events (blue arrows) acting on mitochondria through the Cumulative Square Displacement (CSD). The frequency of these events was higher in the absence of F-actin and lower when vimentin or microtubule networks were disrupted.

Similar articles

Cited by

References

    1. Nunnari, J. & Suomalainen, A. Mitochondria: In sickness and in health. Cell148, 1145–1159 (2012). - PMC - PubMed
    1. Su, É., Villard, C. & Manneville, J.-B. Mitochondria: At the crossroads between mechanobiology and cell metabolism. Biol. Cell115(9), e2300010 (2023). - PubMed
    1. Phuyal, S., Romani, P., Dupont, S. & Farhan, H. Mechanobiology of organelles: Illuminating their roles in mechanosensing and mechanotransduction. Trends Cell Biol.33(12), 1049–1061 (2023). - PubMed
    1. Moore, A. S. & Holzbaur, E. L. Mitochondrial-cytoskeletal interactions: dynamic associations that facilitate network function and remodeling. Curr. Opin. Physio.3, 94–100 (2018). - PMC - PubMed
    1. De Rossi, M. C., Levi, V. & Bruno, L. Retraction of rod-like mitochondria during microtubule-dependent transport. Biosci. Rep.38, BSR20180208 (2018). - PMC - PubMed

LinkOut - more resources