. 2024 Oct 13;15(1):550.
doi: 10.1007/s12672-024-01429-8.

Immunotherapy and pan-apoptotic characterization of the tumor microenvironment in gastric cancer (STAD): a single-cell multidimensional analysis

Affiliations

Immunotherapy and pan-apoptotic characterization of the tumor microenvironment in gastric cancer (STAD): a single-cell multidimensional analysis

Sheng Zhang et al. Discov Oncol. .

Abstract

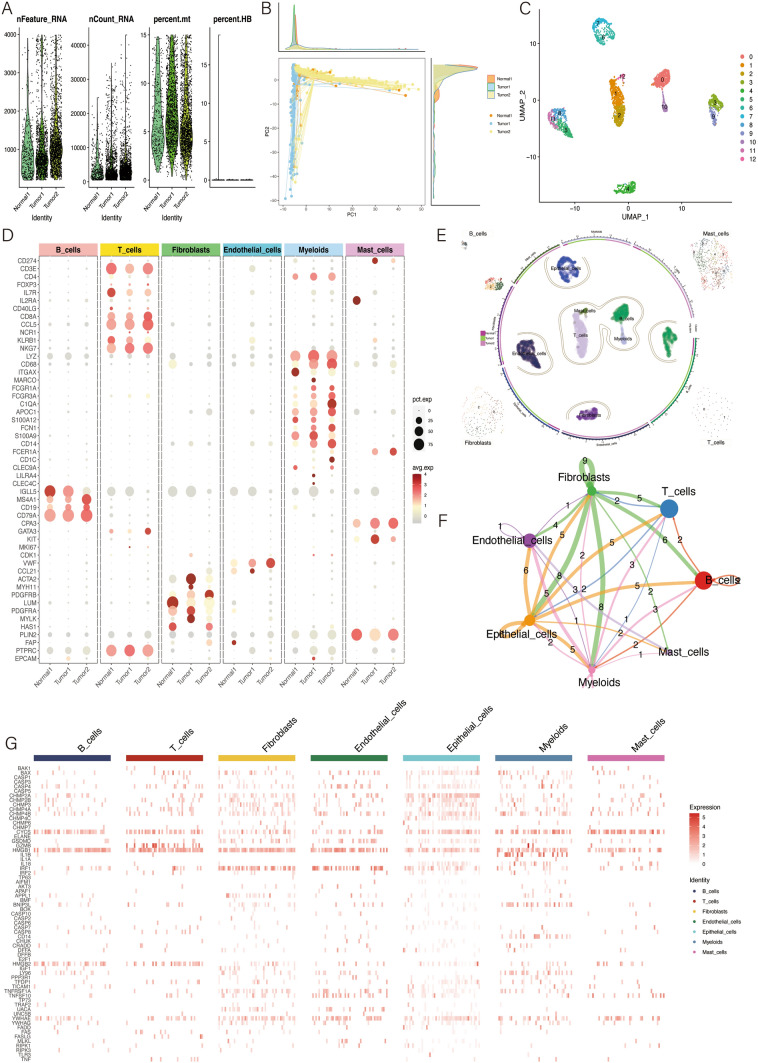
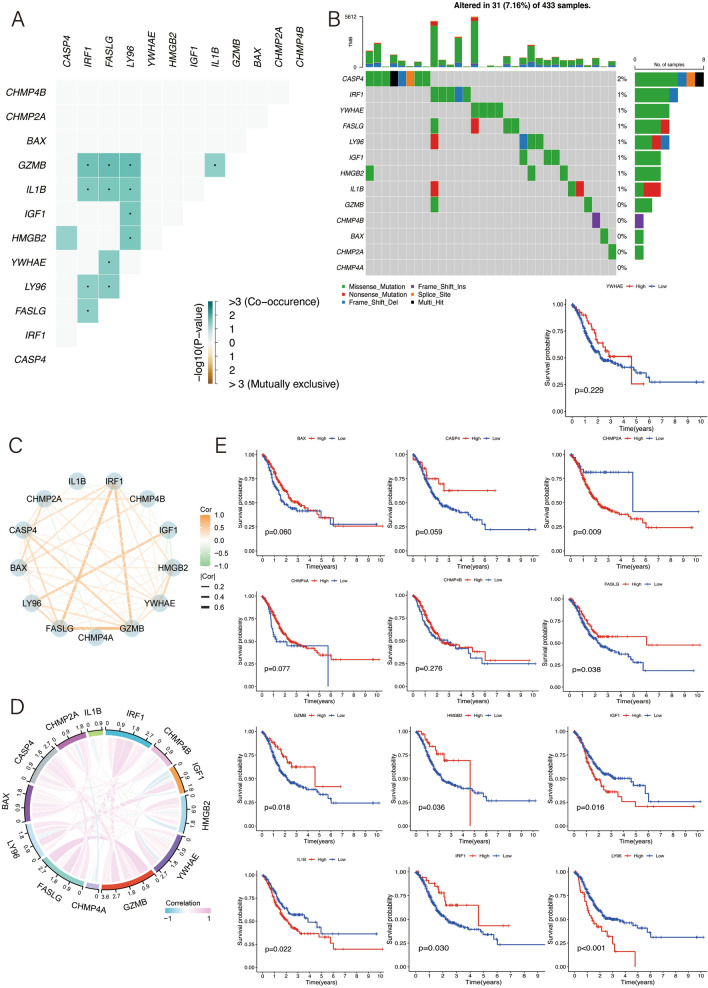
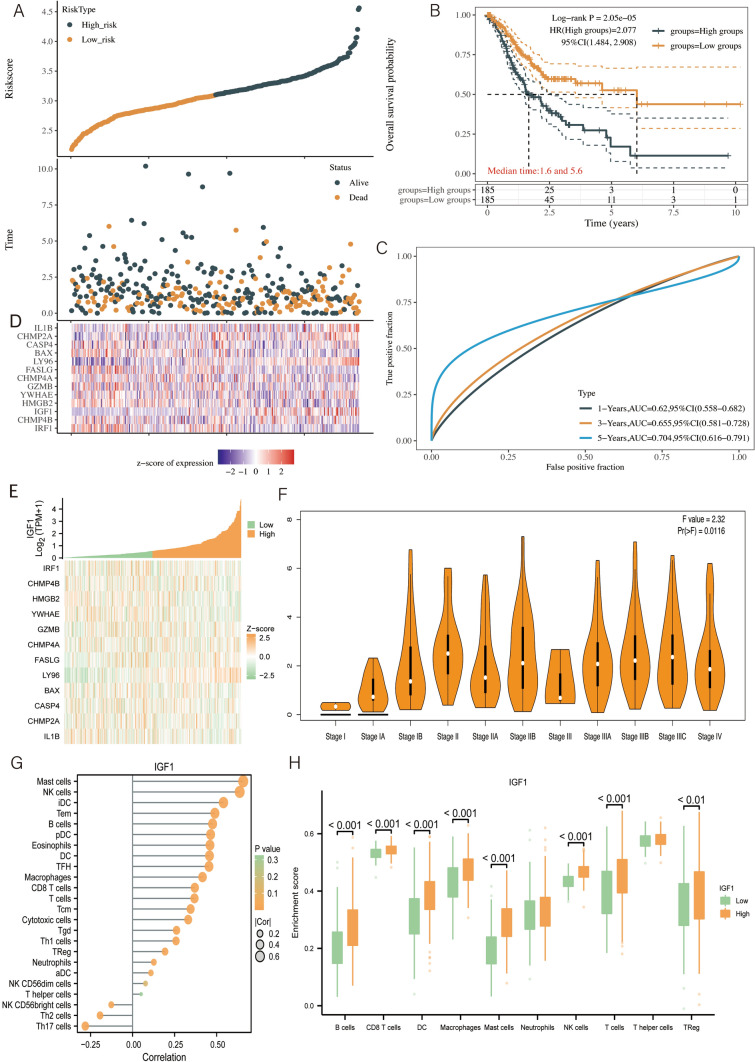
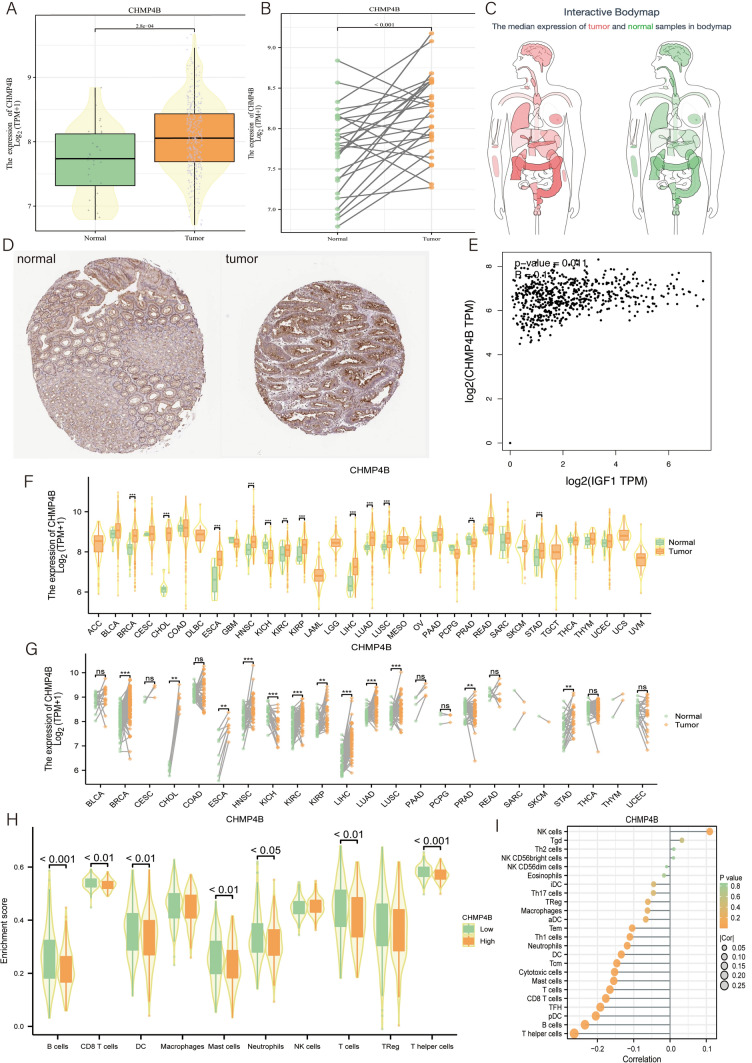
Background: The aim of this study was to elucidate the critical role of autophagy-related gene aggregation in gastric cancer tumor microenvironment cells and to investigate their major roles in cellular functions. In particular, the expression of these genes in tumor-associated fibroblast subtypes was scrutinized in an attempt to explain their cell-subpopulation-specific roles in cell-cell communication and regulation of cellular functions.

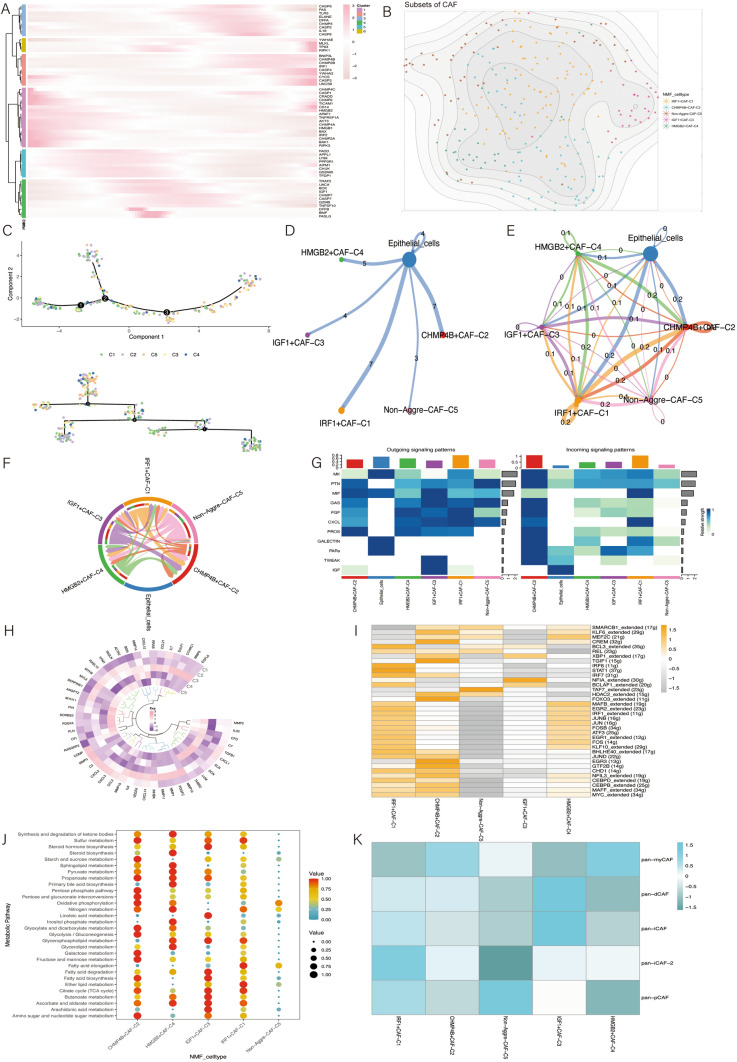
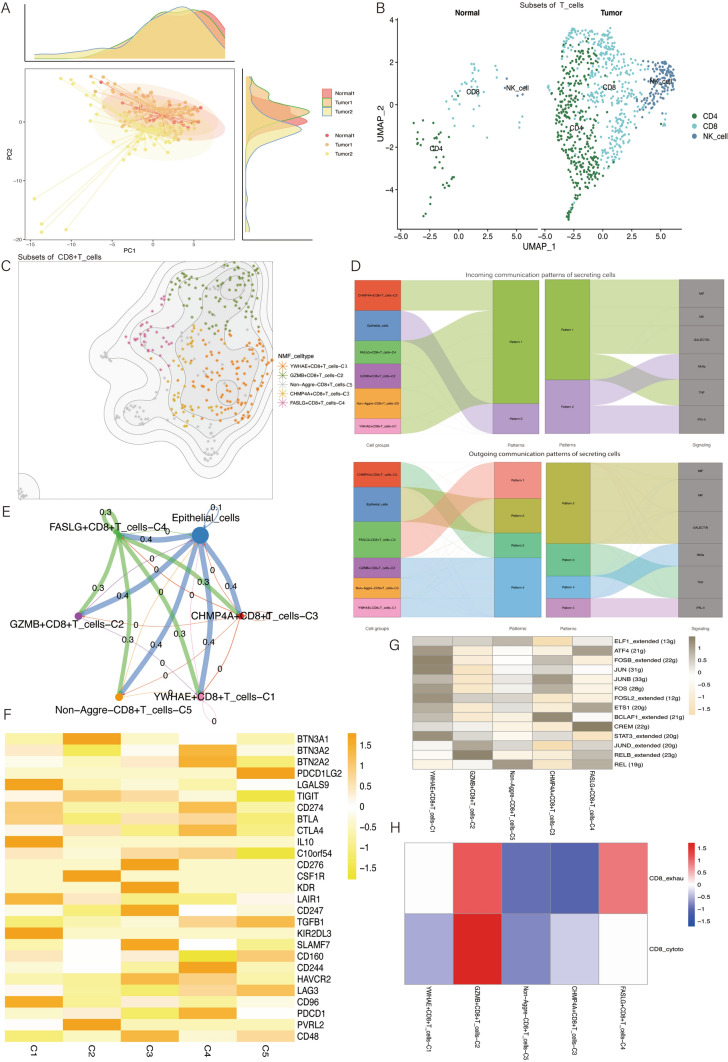
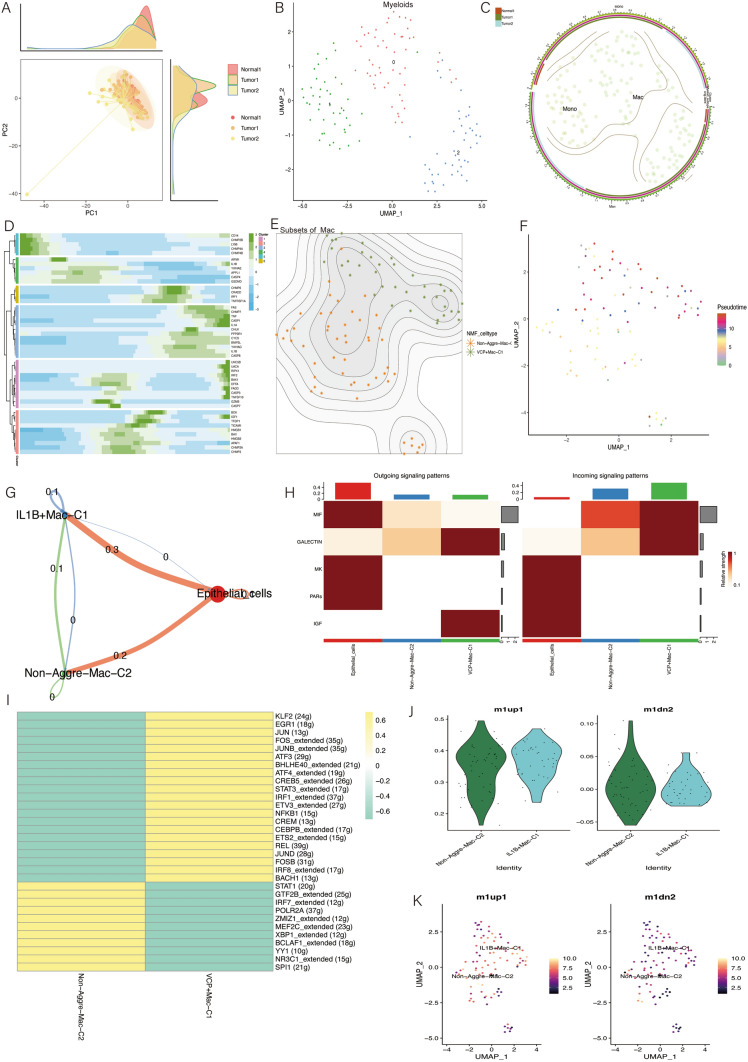
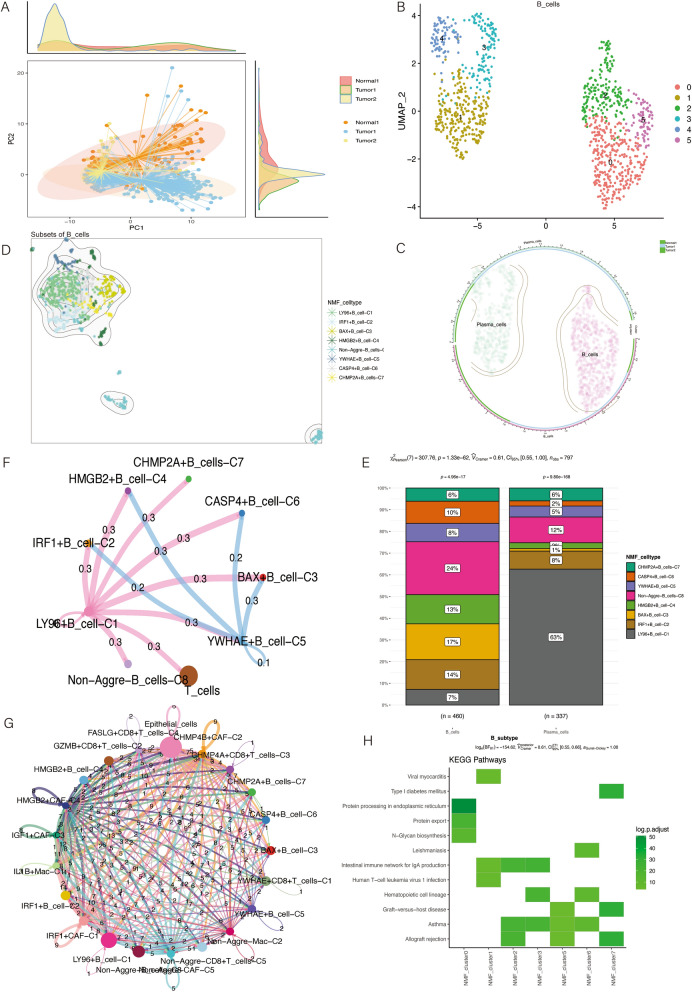
Methods: In this study, single-cell RNA sequencing data were first analyzed in multiple steps, including data preprocessing, cell clustering, and cell classification. Cell subpopulations and gene expression patterns were identified and analyzed using unsupervised non-negative matrix factorization (NMF) techniques. The dynamic expression of autophagy-related gene aggregates in various cell types was deciphered by pseudotime trajectory analysis (PTA). Intercellular communication analysis was performed using the CellChat R software package, revealing the intricate communication patterns and exchange of key signaling molecules between cell subpopulations, and SCENIC analysis was used to identify gene regulatory networks and reveal the mechanisms behind cellular heterogeneity.

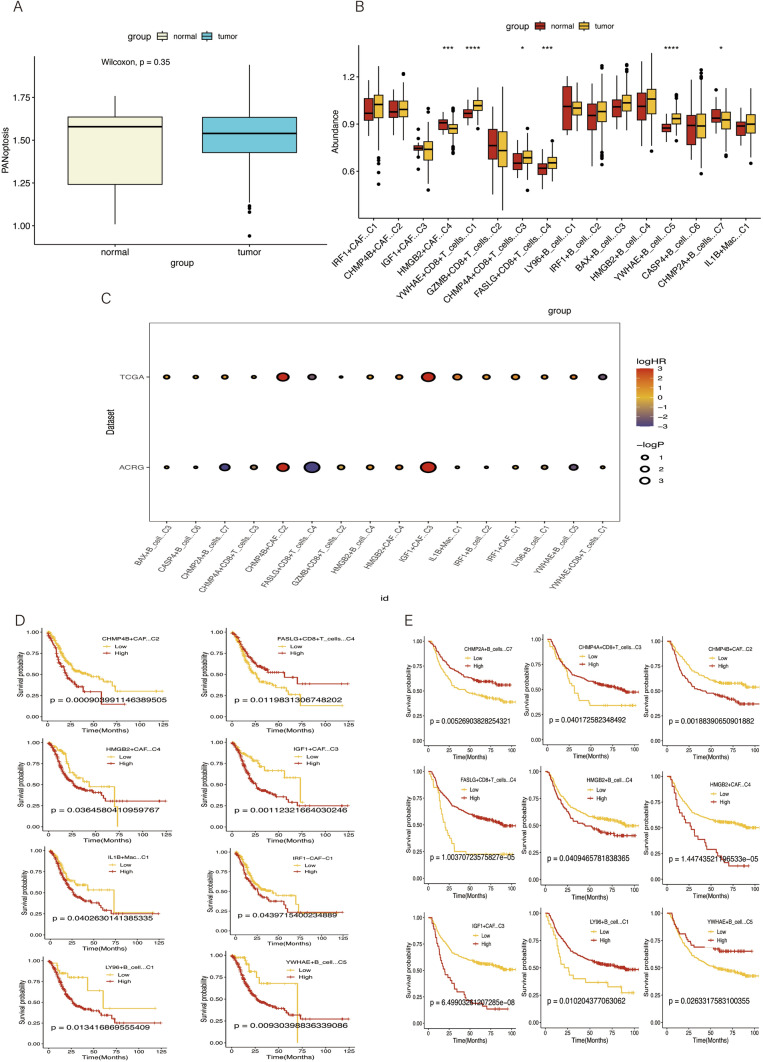
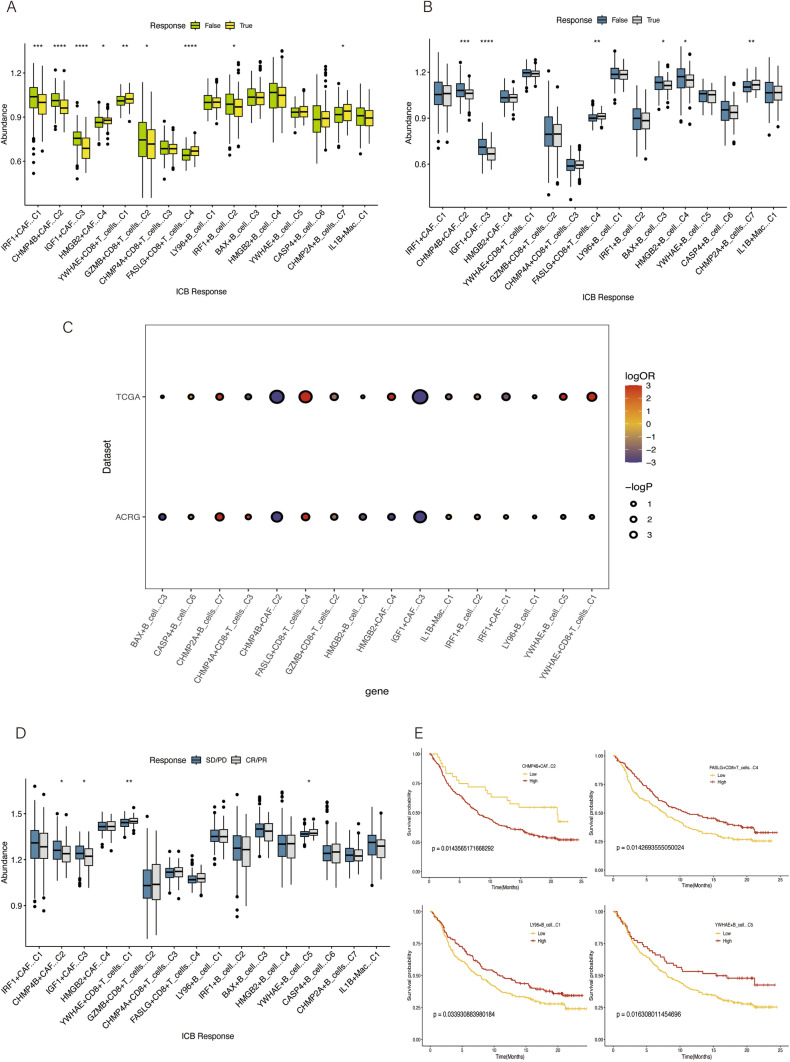
Result: Cell subpopulations associated with pan-apoptosis were identified by NMF decomposition and SCENIC analysis. Cell-cell communication analysis revealed intricate communication patterns and exchange of key signaling molecules between cell subpopulations. Dynamic expression of autophagy-related genes aggregated in the pseudotemporal trajectory of STAD was observed by PTA. In the fibroblast subtype, different ligand-receptor interactions and their key roles in immunomodulation were observed.

Conclusion: By deeply analyzing and comparing gene expression patterns within cellular subpopulations and intercellular communication, this study provides new insights into the role of pan-apoptosis-related genes in regulating immune responses and cellular functions in gastric cancer. These findings pave the way for further exploration of the role of these genes in tumorigenesis and immune regulation, as well as laying the foundation for potential therapeutic strategies.

Keywords: Immunotherapy; Molecular marker; Non-negative matrix factorization; Pan-apoptosis; Single-cell; Stomach cancer.


Conflict of interest statement

The authors declare no competing interests.

Figures

Fig. 1
Fig. 1
A Quality control and screening of single-cell data was performed. B PCA analysis of single-cell samples from gastric cancer. C Clustering of gastric cancer single cells was performed using PCA of single-cell RNA sequencing data. A total of 12 cell clusters were obtained and the downscaled results were visualized using the UMAP method. D Annotation of cell clusters using cell subtype marker genes from single-cell RNA sequencing analysis. E A total of seven cell subpopulations were annotated: T cells, mast cells, B cells, epithelial cells, myeloid cells, endothelial cells, and fibroblasts. F Shows the strength of communication between interacting cells. G A heatmap showing the overall expression profile of pan-apoptosis-related genes in seven cell subgroups
Fig. 2
Fig. 2
A Proposed time-series analysis of pan-apoptosis-related genes in CAF and heatmap showing the expression of these pan-apoptosis-related genes during cell differentiation. B CAF cells were downclustered using NMF, and cell subclusters were annotated with pan-apoptotic genes to obtain five clusters. C Developmental trajectory analysis of NMF subclusters in CAF cells. D Intercellular communication between five NMF tumor-associated fibroblast clusters and epithelial cells. E Overall cellular communication landscape between 5 NMF cell clusters and epithelial cells with each other in cellular communication. F String diagrams illustrating interactions between different cell types mediated through GAS ligand-receptor pairs. G Cytokine expression of five NMF cell clusters and epithelial cells in output signaling mode and input signaling mode in CAF cell communication. H Ring heatmap of CAF key gene expression in 5 NMF cell clusters. I Heatmap of transcription factor expression activity of five NMF cell clusters in SCENIC analysis. J Heatmap for metabolic pathway analysis of five NMF cell clusters. K Heatmap of the correlation of the five NMF CAF clusters with CAF isoforms
Fig. 3
Fig. 3
A Principal Component Analysis (PCA) was performed on T cells. B T cells are categorized into CD8, CD4 and NK subtypes. C Downscaling clustering of CD8T cells using NMF and annotation of cell subclusters with pan-apoptotic genes, resulting in 5 clusters. D Sankey diagram of 5 NMF cell clusters and epithelial cells in output signaling mode and input signaling mode in cell communication. E Overall cell communication between 5 NMF cell clusters and epithelial cells in cell communication. F Immunosuppressive factor expression in the 5 NMF cell clusters. G Heatmap of transcription factor expression activity in 5 NMF cell clusters in SCENIC analysis. H Heatmap of the correlation between the 5 NMF cell clusters and T cell depletion and T cell toxicity
Fig. 4
Fig. 4
A Principal component analysis (PCA) was performed on myeloid cells. B Clustering of the myeloid lineage was performed using PCA. A total of three cell clusters were obtained and the downscaled results were visualized using the UMAP method. C Myeloid cells were annotated into two subtypes: macrophages and monocytes. D Mimetic time-series analysis of pan-apoptosis-related genes in macrophages and heatmap showing the expression of these pan-apoptosis-related genes during cell differentiation. E Downscaling clustering of macrophages using NMF and annotation of cell subclusters with pan-apoptotic genes yielded 2 clusters. F Developmental trajectory analysis of NMF subclusters in macrophages. G Overall cell communication between 2 NMF cell clusters and epithelial cells in cell communication. H Cytokine expression of 2 NMF cell clusters and epithelial cells in output signaling mode and input signaling mode in macrophage cell communication. I Heatmap of transcription factor expression activity of 2 NMF cell clusters in SCENIC analysis. J, K M1, M2 subtype scores of macrophages from 2 NMF cell clusters
Fig. 5
Fig. 5
A Principal component analysis (PCA) was performed on B cells. B Clustering of myeloid lineages was performed using PCA. A total of six cell clusters were obtained and the downscaled results were visualized using the UMAP method. C B cells were categorized into two subtypes, B cells and plasma cells. D B cells were clustered using NMF for dimensionality reduction, and cell subclusters were annotated with pan-apoptotic genes, and 8 clusters were obtained. E Percentage of the 8 NMF cell clusters in B cells and plasma cells. F Overall cellular communication landscape of the 8 NMF cell clusters and epithelial cells in cellular communication with each other. G Cell communication landscape of all NMF clusters with each other
Fig. 6
Fig. 6
A Pan-apoptotic gene scores in tumor samples and normal samples. B Scores of all NMF cell clusters in STAD tumor samples and normal samples. C One-way cox regression model of Bulk RNA-seq, where the color represents logHR value, the larger the value, the NMF cell clusters are risk factors for gastric cancer and can lead to poor prognosis of gastric cancer patients. D km curve of TCGA_STAD dataset. E km curve of GSE66222 dataset
Fig. 7
Fig. 7
A, B Scores of NMF cell clusters in the responding and non-responding groups as predicted by immunotherapy response in the TCGA_STAD dataset, GEO dataset (GSE66222). C Risk and protective factors for immunotherapy were analyzed using a logit model, where a lower and higher logOR indicates a better immunotherapy outcome. D Validation using an immunotherapy cohort of bladder cancer characterized by four immunotherapy responses including complete remission (CR), partial remission (PR), stable disease (SD) and progressive disease (PD). (*p < 0.05, **p < 0.01, ***p < 0.001, ****p < 0.0001). E km curves of bladder cancer patients
Fig. 8
Fig. 8
A Heatmap of gene mutation correlation. B Waterfall plot of gene mutations. C, D Reticulation and chord plots demonstrating the correlation of pan-apoptotic marker gene expression. E Single gene km curves of pan-apoptotic marker genes in TCGA_STAD
Fig. 9
Fig. 9
A Pan-apoptotic marker genes categorize the TCGA_STAD cohort into high and low risk groups. B Survival curves of high and low risk groups of pan-apoptotic marker genes in gastric cancer patients. C Receiver operating characteristic curves (ROC) and area under the curve (AUC) of the models. D Expression of pan-apoptotic marker genes in the high and low risk groups of pan-apoptotic marker genes in gastric cancer patients in TCGA_STAD samples. E IGF1 delineates the expression of pan-apoptotic marker genes in high and low risk groups in TCGA_STAD samples. F Expression of IGF1 in different tumor stages. G Correlation between IGF1 and immune cells. H Differences in immune cell expression in IGF1 high and low risk groups
Fig. 10
Fig. 10
A, B Unpaired and paired samples demonstrating CHMP4B gene expression in tumor and normal groups. C Demonstrating the common organs of CHMP4B gene expression in human body. D Immunohistochemical sections verified the high expression of CHMP4B gene in gastric cancer tissues. E Correlation analysis of CHMP4B gene and IGF1 gene. F, G Unpaired and paired samples demonstrated the pan-cancer expression of CHMP4B gene. H Correlation between CHMP4B and immune cells. I Differences in immune cell expression in high and low risk groups of CHMP4B

Similar articles

References

    1. Ni B, Song X, Shi B, Wang J, Sun Q, Wang X, Xu M, Cao L, Zhu G, Li J. Research progress of ginseng in the treatment of gastrointestinal cancers. Front Pharmacol. 2022;13:1036498. - PMC - PubMed
    1. Imounga Desroziers L, Belliardo S, Deloumeaux J, Plenet J, Bhakkan-Mambir B, Péruvien J, Chatignoux E, Macni J, Boullard M, Beaubrun-Renard M, Véronique-Baudin J, Joachim C. Burden of gastric and digestive cancers in the French Caribbean: perspectives from population-based cancer registries of Martinique, Guadeloupe and French Guiana (2007–2014). BMJ Open. 2022;12: e047167. - PMC - PubMed
    1. Wang M, Wang S, Su Q, Ma T. Effect of combining early chemotherapy with Zhipu Liujunzi Decoction under the concept of strengthening and consolidating body resistance for gastric cancer patients and nursing strategy. Contrast Media Mol Imaging. 2021;2021:2135924. 10.1155/2021/2135924. - PMC - PubMed
    1. Qian H, Cui N, Zhou Q, Zhang S. Identification of miRNA biomarkers for stomach adenocarcinoma. BMC Bioinformatics. 2022;23:181. - PMC - PubMed
    1. Pennathur A, Gibson MK, Jobe BA, Luketich JD. Oesophageal carcinoma. Lancet. 2013;381:400–12. - PubMed

LinkOut - more resources