. 2025 Apr;62(4):4115-4138.
doi: 10.1007/s12035-024-04533-6. Epub 2024 Oct 14.

Involvement of BK Channels and Ryanodine Receptors in Salicylate-induced Tinnitus

Affiliations

Involvement of BK Channels and Ryanodine Receptors in Salicylate-induced Tinnitus

Wenying Shi et al. Mol Neurobiol. 2025 Apr.

Abstract

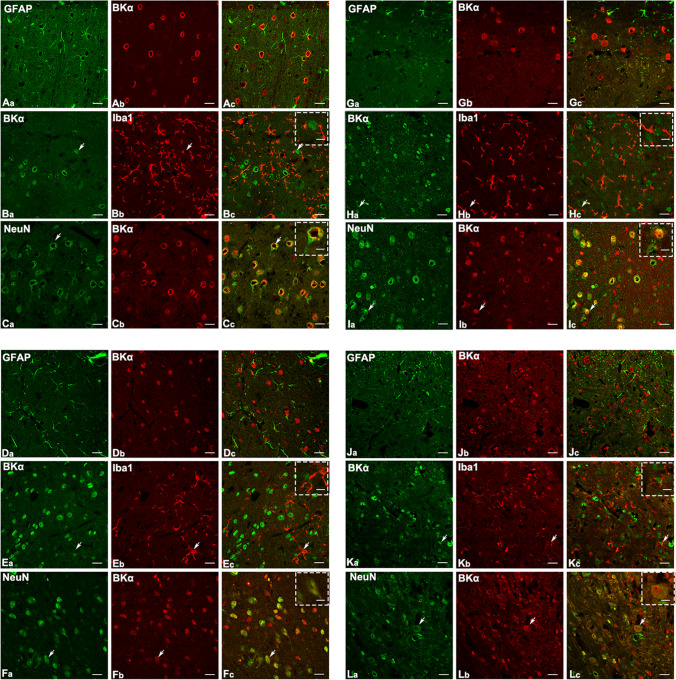
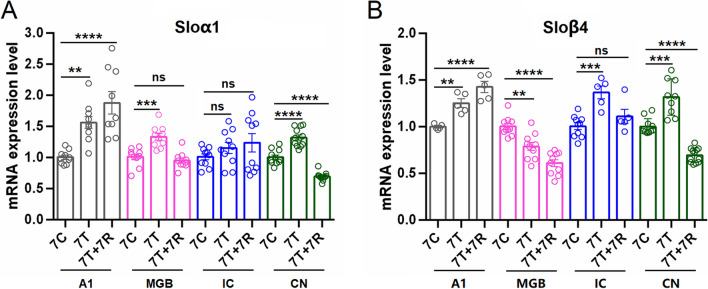
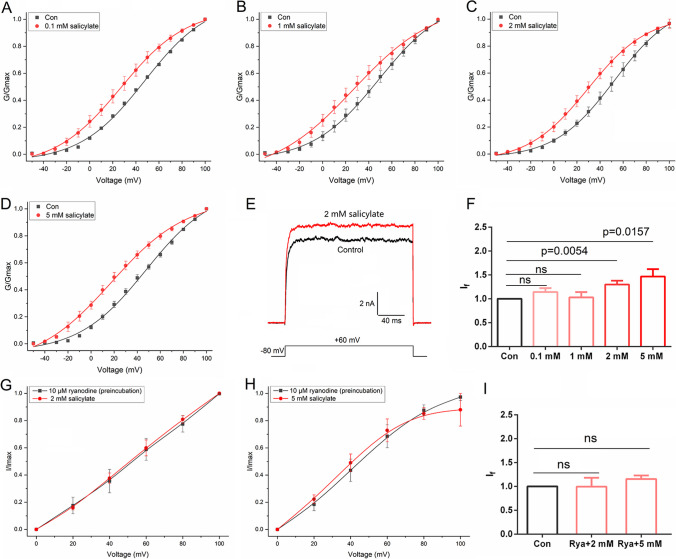
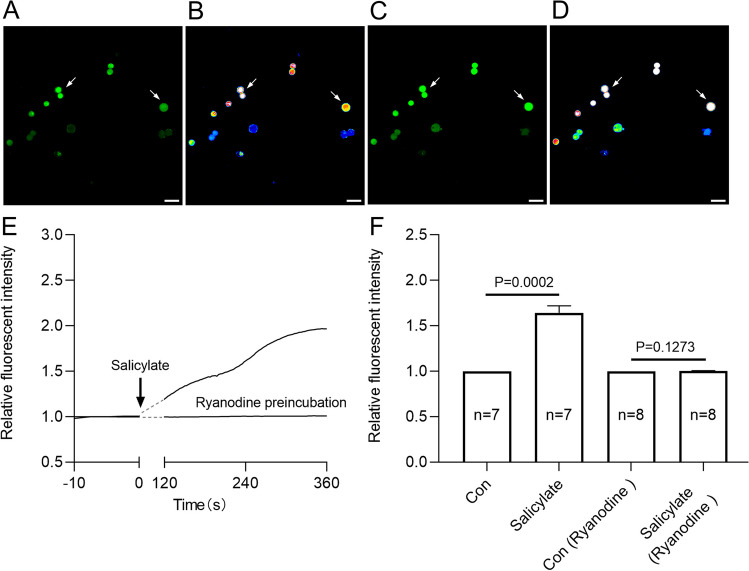
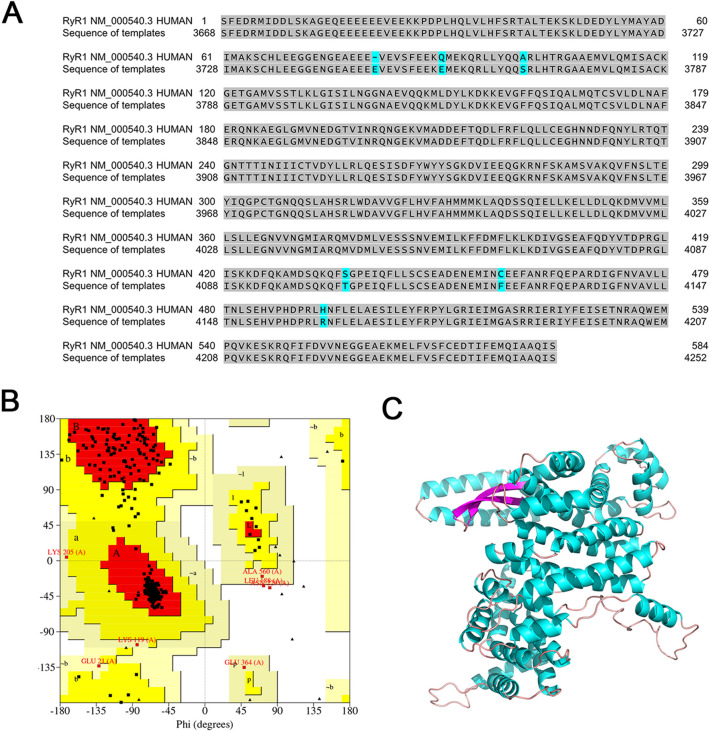
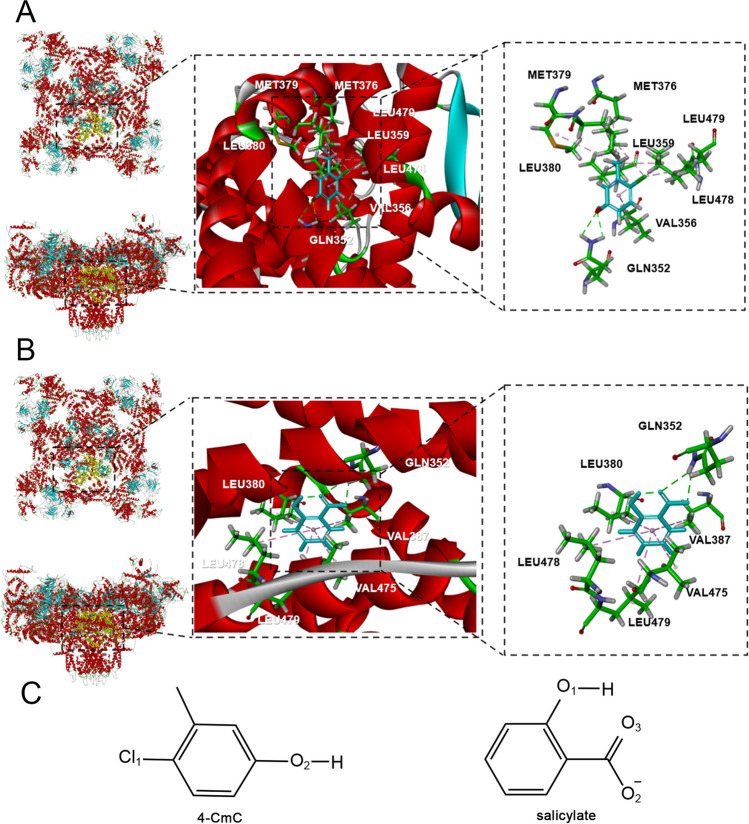
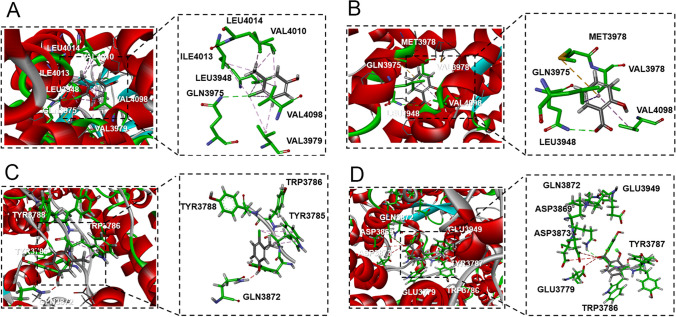
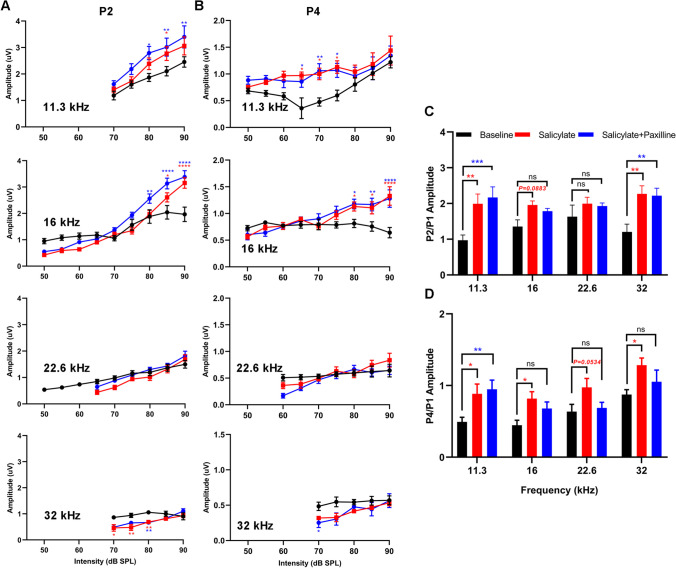
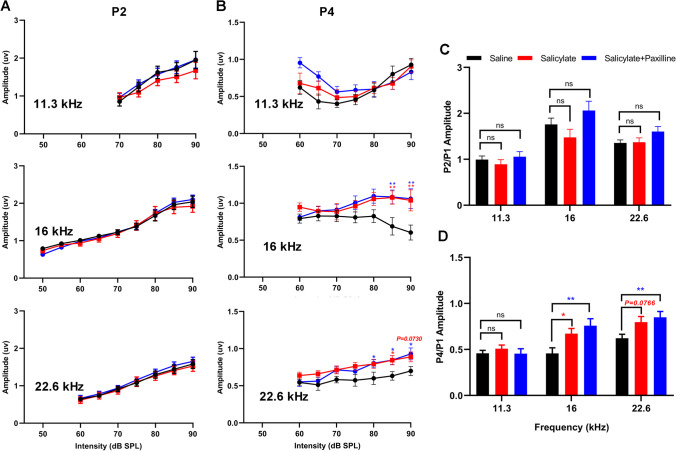
Neural hyperexcitability of the central auditory system is a key pathological characteristic of tinnitus, but its underlying molecular mechanisms remain elusive. The large-conductance Ca2+-activated K+ channel (BK) plays a crucial role in down- or upregulating neuronal activity. This study aims to investigate the role of BK channels in mediating tinnitus-associated neural hyperexcitability and elucidate the mechanisms behind it. Immunofluorescent staining revealed extensive expression of the BK channels on neurons within the central auditory system of rats. After long-term systemic administration of salicylate, a stable tinnitus inducer, we observed a significant change in the expression levels of BKα and β4 subunits in the rat central auditory system. In addition, salicylate was found to enhance the outward potassium currents mediated by the BK channel when exogenously expressed in HEK293 cells. Interestingly, this effect could be blocked by ryanodine, a potent inhibitor of ryanodine receptors (RyRs). Molecular docking identified Gln4020 within the central domain of RyR as a key residue in RyR-salicylate interactions. The results indicated that salicylate might directly activate RyRs leading to Ca2+ release from endoplasmic reticulum, and increased BK currents subsequently. Systemic treatment with paxilline, a potent blocker of BK channel, selectively reversed the increased P4/P1 amplitude ratios in the frequency region of tinnitus perception induced by single-dose salicylate administration. These results suggest that BK channels and ryanodine receptors may play a selective role in salicylate-induced tinnitus.

Keywords: BK channel; Hyperexcitability; Ryanodine receptor; Salicylate; Tinnitus.


Conflict of interest statement

Declarations. Ethics Approval: All procedures involving animals were carried out in accordance with the National Institutes of Health guidelines for the Care and Use of Laboratory Animals, and were approved by the Ethics Committee of Hebei University, China. Consent to Participate: Not applicable. Consent for Publication: All authors have read and approved the final manuscript for publication. Competing Interests: The authors declare no competing interests.

Figures

Fig. 1
Fig. 1
Distribution of BKα subunit in the central auditory system. Representative images show the co-localization of the BKα subunit with three specific markers: GFAP (labeling astrocytes), IBA1 (labeling microglia), and NeuN (labeling neurons). AC The A1 cortex, DF MGB, GI IC, and JL CN. GFAP-immunoreactivity (ir) is shown in green (Aa, Da, Ga and Ja), IBA1-ir is shown in red (Bb, Eb, Hb and Kb), NeuN-ir is shown in green (Ca, Ga, Ia, and La), BKα subunit-ir is shown in red (Ab, Cb, Db, Fb, Gb, Ib, Jb, Lb) and in green (Ba, Ea, Ha, Ka). Merged signal are shown in yellow. White arrows indicate representative cells that are co-labeled. Scale bars, 20 μm; scale bar in the dotted frame, 10 μm
Fig. 2
Fig. 2
Distribution of BKβ4 subunit in the central auditory system. Representative images show the co-localization of the BKβ4 subunit with three specific markers: GFAP (labeling astrocytes), IBA1 (labeling microglia), and NeuN (labeling neurons). AC The A1 cortex, DF MGB, GI IC, and JL CN. GFAP-ir is shown in green (Aa, Da, Ga and Ja), IBA1-ir is shown in red (Bb, Eb, Hb) and in green (Ka), NeuN-ir is shown in green (Ca, Fa, Ia, and La), BKβ4 subunit-ir is shown in red (Ab, Cb, Db, Fb, Gb, Ib, Jb, Kb, Lb) and in green (Ba, Ea, Ha). Merged signal are shown in yellow. White arrows indicate cells that are co-labeled. Scale bars, 20 μm; scale bar in the dotted frame, 10 μm
Fig. 3
Fig. 3
Altered expression of BKa and BKβ4 subunits in the central auditory system following salicylate administration. A Quantitative analysis of mRNA of BKα subunit in the A1 cortex, MGB, IC, and CN from three groups (7C, control group receiving saline for 7 consecutive days; 7 T, tinnitus group receiving salicylate for 7 consecutive days; 7 T + 7R, recovery group) in chronic experiments. B Quantitative analysis of BKβ4 subunit mRNA expression in the same brain regions and groups as in panel A. One-way analysis of variance (ANOVA) followed by post hoc Scheffé test was used for multiple comparisons. Data are presented as mean ± SEM. *p < 0.05, **p < 0.01, ***p < 0.001, ****p < 0.0001 compared with the control group
Fig. 4
Fig. 4
Effect of salicylate on BK channel expressed in HEK293T cells. AD Normalized conductance plots fit well with the Boltzmann function in the absence and presence of salicylate at various concentrations (0.1 mM, n = 3; 1 mM, n = 8; 2 mM, n = 10; 5 mM, n = 9). The holding voltage was − 80 mV, and the currents were elicited by step pulses ranging from − 50 to + 100 mV for 200 ms with 10-mV increments. Salicylate significantly shifted the voltage-dependent activation curves. E Representative whole-cell current traces from HEK 293 T cells expressing BK channels before and after the application of 2 mM salicylate. The holding voltage was − 80 mV and the currents were elicited by a + 60 mV pulse. F Statistical analysis of the currents evoked by + 60 mV pulse before and after salicylate application. Data are presented as mean ± SEM. The significant difference between control and salicylate application was assessed using a paired Student’s t-test, with p < 0.05 considered significant. GH Normalized currents of BK channels preincubated with 10 μM ryanodine, before and after application of 2 mM (n = 5) and 5 mM (n = 5) salicylate. I Statistical analysis of currents evoked by + 60 mV pulse, before and after application of 2 mM and 5 mM salicylate. Data are presented as mean ± SEM, with significant difference assessed by paired Student’s t-test
Fig. 5
Fig. 5
Salicylate elevates intracellular Ca2+ through activating ryanodine receptors. AD Representative calcium images of HEK293T cells before and after salicylate treatment. E Normalized traces of the Ca2+ transient in HEK293T cells induced by the treatment of salicylate. F Bar graph quantifies the effect of 2 mM salicylate on the intracellular Ca2+ concentration, without or with preincubation of 10 µM ryanodine before calcium imaging. White arrows mark representative recorded cells. Data are presented as the mean ± SEM, significant differences between control and salicylate (n = 7 recorded cells), or control and salicylate in the present of ryanodine preincubation (n = 8 recorded cells) were tested by paired Student’s t-test, p value is compared with the control group
Fig. 6
Fig. 6
Crystal structure map of the central domain of hRyR1. A Homologous amino acid sequence of the central domain from human RyR1 (top), and amino acid sequence of the central domain from rabbit RyR1 (bottom). B Ramachandran image of hRyR1. C 3D structure of the central domain of hRyR1
Fig. 7
Fig. 7
Docking results for the interaction of 4-CmC and salicylate with the central domain of hRyR1. A 4-CmC forms a hydrogen bond with Gln352 (4020), and engage in hydrophobic interaction with other seven residues (Leu380 (4048), Leu478 (4146), Met379 (4047), Leu479 (4147), Leu359 (4027), Met376 (4044), Val356 (4024)) in the central domain of hRyR1. B Salicylate forms two hydrogen bonds with Gln352 (4020), and engage in hydrophobic interaction with other five residues (Leu479 (4147), Leu380 (4048), Val387 (4055), Leu478 (4146), Leu475 (4143)) in the central domain of hRyR1. The numbers listed in brackets represent the location of residues in full-length amino acid sequence of RyR1. C The chemical structures of 4-CmC and salicylate obtained from PubChem database
Fig. 8
Fig. 8
Docking results for the interaction of 4-CmC and salicylate with the central domain of hRyR2 and hRyR3. A 4-CmC forms a hydrogen bond with Gln3975 residue, and engages in hydrophobic interaction with other six residues (Ile4013, Val4010, Leu4014, Val4098, Val3979, Leu3948) in the central domain of hRyR2. B Salicylate forms a hydrogen bond with Gln3975 residue, and engage in hydrophobic interaction with other four residues (Val4098, Met3978, Leu3948, Val3979) in the central domain of hRyR2. C 4-CmC forms an adverse interaction with Gln3872 of RyR3, and just engage in hydrophobic interaction with Trp3786. D Salicylate forms a hydrogen bond with Gln3872 and engage in hydrophobic interaction with Trp3786 in the central domain of hRyR3
Fig. 9
Fig. 9
Paxilline treatment does not affect the suppressed auditory nerve output caused by acute salicylate administration. A ABR stimulus frequency plotted as a function of threshold shift relative to baseline for post-salicylate and post-salicylate plus paxilline. A two-way ANOVA of threshold shifts showed a main effect of treatment (F(2,168) = 543.0, p < 0.0001) and frequency (F(6,168) = 197.8, p < 0.0001) when salicylate (red) and salicylate plus paxilline (blue) groups were included. Post hoc analyses showed that thresholds increased relative to baseline following salicylate administration, but were not further altered by paxilline treatment. B The latencies of ABR wave I of different frequency in salicylate and salicylate plus paxilline groups are prolonged compared to those in baseline. Two-way ANOVAs indicated a main effect of treatment for all frequencies (11.3 kHz: F(2, 103) = 18.43, p < 0.0001; 16 kHz: F(2,183) = 243.6, p < 0.0001; 22.6 kHz: F(2,127) = 122.3, p < 0.0001; 32 kHz: F(2,88) = 68.19, p < 0.0001). Post hoc analyses show the delayed latencies following salicylate administration compared with baseline, paxilline has no further impaction. C The amplitudes of ABR wave I plotted as a function of intensity for 11.3, 16, 22.6, and 32 kHz tones. Two-way ANOVAs indicated a main effect of treatment for all slightly higher frequencies (11.3 kHz: F(2,103) = 4.988, p = 0.0086; 16 kHz: F(2,183) = 25.48, p < 0.0001; 22.6 kHz: F(2,128) = 25.83, p < 0.0001; 32 kHz: F(2,76) = 38.81, p < 0.0001). Post hoc analyses indicate that salicylate reduces P1 amplitudes relative to baseline when administered alone or in the presence of paxilline. Red asterisks indicate a significant difference between baseline and salicylate, blue asterisks indicate a significant difference between baseline and salicylate plus paxilline. Data are presented as mean ± SEM and evaluated with two-way ANOVA followed by Bonferroni post-test (*p < 0.05, **p < 0.01, ***p < 0.001, ****p < 0.0001; n = 8)
Fig. 10
Fig. 10
Paxilline treatment suppresses the increased gain caused by acute salicylate administration. A Changes in the amplitude of ABR wave II, compared to the baseline, Two-way ANOVAs indicated a main effect of treatment for all frequencies (11.3 kHz: F(2,105) = 13.18, p < 0.0001; 16 kHz: F(2,183) = 10.99, p < 0.0001; 22.6 kHz: F(2,144) = 4.465, p < 0.0001; 32 kHz: F(2,91) = 13.93, p < 0.0001). There was also a main effect of intensity (11.3 kHz: F(4,105) = 21.40, p < 0.0001; 16 kHz: F(8,183) = 81.96, p < 0.0001; 22.6 kHz: F(5,144) = 21.59, p < 0.0001; 32 kHz: F(4,91) = 7.447, p < 0.0001). Post hoc analyses show the amplitudes increase in salicylate group and salicylate plus paxilline group at 11.3 kHz and 16 kHz (ranging from 80 to 90 dB), the amplitudes decrease at 32 kHz (ranging from 70 to 80 dB). B Changes in the amplitude of ABR wave IV compared to baseline. Two-way ANOVAs indicated a main effect of treatment for all frequencies (11.3 kHz: F(2, 170) = 14.93, p < 0.0001; 16 kHz: F(2, 182) = 9.879, p < 0.0001; 22.6 kHz: F(2,128) = 2.257, p = 0.1089; 32 kHz: F(2,89) = 6.445, p = 0.0024). There was also a main effect of intensity (11.3 kHz: F(8,170) = 6.079, p < 0.0001; 16 kHz: F(8,182) = 8.597, p < 0.0001; 22.6 kHz: F(6,128) = 7.386, p < 0.0001; 32 kHz: F(4,89) = 3.764, p = 0.0071). Post hoc analyses show the amplitudes increase in salicylate group and salicylate plus paxilline group at 11.3 kHz across 65 to 75 dB and 16 kHz across 80 to 90 dB. C Mean amplitude of P2 relative to P1 for 90 dB tones. A two-way ANOVA showed a main effect of treatment (F(2, 84) = 17.16; p < 0.0001), but not frequency (F(3, 84) = 0.6797). Post hoc analyses indicated that salicylate administration alone (red) and salicylate plus paxilline treatment (blue) both increase the P2/P1 ratio relative to baseline (black), at 11.3 kHz, 16 kHz, and 32 kHz. D Mean amplitude of P4 relative to P1 for 90 dB tones. The P4/P1 ratios increase following salicylate treatment (F(2, 84) = 12.87; p < 0.0001), paxilline treatment reserves the increased P4/P1 ratios at 16 kHz, 22.6 kHz, and 32 kHz. Data are presented as mean ± SEM and evaluated with two-way ANOVA followed by Bonferroni post-test (*p < 0.05, **p < 0.01, ***p < 0.001, ****p < 0.0001; n = 8). Red and blue asterisks indicate significant difference of salicylate vs baseline and salicylate plus paxilline vs baseline, respectively
Fig. 11
Fig. 11
Paxilline treatment and chronic salicylate administration do not affect auditory nerve output. A A two-way ANOVA of threshold showed no effect of treatment (salicylate vs. saline, F(1, 140) = 0.05227, p = 0.8195; salicylate plus paxilline vs. saline, F(1, 132) = 0.03440, p = 0.8531). Post hoc analyses showed that thresholds are not changed relative to saline following salicylate administration, salicylate plus paxilline treatment decreases the thresholds at 32 kHz. B The plot showed the latencies of ABR wave I at 11.3 kHz, 16 kHz, 22.6 kHz, and 32 kHz. Two-way ANOVAs indicated a main effect of treatment for all frequencies (11.3 kHz: F(2,151) = 6.756, p = 0.0015; 16 kHz: F(2,272) = 11.46, p < 0.0001; 22.6 kHz: F(2,242) = 9.606, p < 0.0001; 32 kHz: F(2,201 = 8.800, p = 0.0002). There was also a main effect of intensity (11.3 kHz: F(4,151) = 29.70, p < 0.0001; 16 kHz: F(8,272) = 131.1, p < 0.0001; 22.6 kHz: F(7,242) = 78.78, p < 0.0001; 32 kHz: F(6,201) = 46.35, p < 0.0001). Post hoc analyses show no significant difference in latency values compared with saline group. C The plot showed the amplitudes of ABR wave I at 11.3 kHz, 16 kHz, 22.6 kHz, and 32 kHz. Two-way ANOVAs indicated a main effect of treatment for all frequencies (11.3 kHz: F(2,155) = 3.107, p = 0.0475; 16 kHz: F(2,273) = 5.019, p = 0.0072; 22.6 kHz: F(2,245) = 1.218, p = 0.2976; 32 kHz: F(2,209) = 4.108, p = 0.0178). There was also a main effect of intensity (11.3 kHz: F(4,155) = 47.23, p < 0.0001; 16 kHz: F(8,273) = 39.65, p < 0.0001;22.6 kHz: F(7,245) = 86.57, p < 0.0001; 32 kHz: F(6,209) = 33.28, p < 0.0001). Post hoc analyses show no significant difference in amplitude values compared with saline group. Red and blue asterisks indicate significant difference of salicylate vs saline and salicylate plus paxilline vs saline, respectively. Data are presented as mean ± SEM and evaluated with two-way ANOVA followed by Bonferroni post-test (*p < 0.05, **p < 0.01, ***p < 0.001, ****p < 0.0001; n = 10–14)
Fig. 12
Fig. 12
Paxilline treatment does not suppress the increased gain in early auditory structures caused by chronic salicylate administration. A Compared to the saline group, there are no significant changes of the amplitude of ABR wave II in the two treatment groups. Two-way ANOVAs indicated a main effect of treatment for all frequencies (11.3 kHz: F(2, 151) = 1.788, p = 0.1708; 16 kHz: F(2, 261) = 0.3734, p = 0.6888; 22.6 kHz: F(2, 218) = 1.290, p = 0.2774). There was also a main effect of intensity (11.3 kHz: F(4,151) = 15.06, p < 0.0001; 16 kHz: F(8,261) = 64.17, p < 0.0001; 22.6 kHz: F(6,218) = 40.57, p < 0.0001). Post hoc analyses show the amplitudes not change in salicylate group and salicylate plus paxilline group. B Changes in the amplitude of ABR wave IV compared to saline. Two-way ANOVAs indicated main effect of treatment for all frequencies (11.3 kHz (F(2,188) = 2.492, p = 0.0855; 16 kHz: F(2, 223) = 12.71, p < 0.0001; 22.6 kHz: F(2, 218) = 15.11, p < 0.0001). Post hoc analyses show the amplitudes not change in salicylate group and salicylate plus paxilline group at 11.3 kHz, the amplitudes increase in salicylate group and salicylate plus paxilline group at 16 kHz (ranging from 85 to 90 dB) and 22.6 kHz (ranging from 80 to 90 dB). C P2/ P1 ratios for 90 dB tones. A two-way ANOVA showed a main effect of treatment (F(2, 90) = 5.162; p = 0.0075), and a main effect of frequencies (F(2, 90) = 28.23, p < 0.0001). Post hoc analyses indicated that salicylate administration alone (red) and salicylate plus paxilline treatment (blue) not change the P2/P1 ratio relative to saline (black), at 11.3 kHz, 16 kHz, and 22.6 kHz. D P4/ P1 ratios for 90 dB tones. A two-way ANOVA showed a main effect of treatment (F(2,115) = 7.898, p = 0.0006), and a main effect of frequencies (F(2, 115) = 18.77, p < 0.0001). Post-hoc analyses indicated that salicylate administration alone (red) and salicylate plus paxilline treatment (blue) increased the P4/P1 ratio compared to saline (black), at 16 kHz and 22.6 kHz. Data are presented as mean ± SEM and evaluated with two-way ANOVA followed by Bonferroni post-test (*p < 0.05, **p < 0.01, ***p < 0.001, ****p < 0.0001; n = 10–14)

Similar articles

References

    1. Baguley D, McFerran D, Hall D (2013) Tinnitus. Lancet 382(9904):1600–1607. 10.1016/S0140-6736(13)60142-7 - PubMed
    1. Piccirillo JF, Rodebaugh TL, Lenze EJ (2020) Tinnitus. JAMA 323(15):1497–1498. 10.1001/jama.2020.0697 - PubMed
    1. Shore SE, Roberts LE, Langguth B (2016) Maladaptive plasticity in tinnitus–triggers, mechanisms and treatment. Nat Rev Neurol 12(3):150–160. 10.1038/nrneurol.2016.12 - PMC - PubMed
    1. Brozoski TJ, Bauer CA (2005) The effect of dorsal cochlear nucleus ablation on tinnitus in rats. Hear Res 206(1–2):227–236. 10.1016/j.heares.2004.12.013 - PubMed
    1. Brozoski TJ, Wisner KW, Sybert LT, Bauer CA (2012) Bilateral dorsal cochlear nucleus lesions prevent acoustic-trauma induced tinnitus in an animal model. J Assoc Res Otolaryngol 13(1):55–66. 10.1007/s10162-011-0290-3 - PMC - PubMed

Substances

LinkOut - more resources