. 2024 Nov 18;45(6):1276-1286.
doi: 10.24272/j.issn.2095-8137.2024.173.

Integrative cross-species transcriptome analysis reveals earlier occurrence of myelopoiesis in pre-circulation primates compared to mice

Affiliations

Integrative cross-species transcriptome analysis reveals earlier occurrence of myelopoiesis in pre-circulation primates compared to mice

Junjie Du et al. Zool Res. .

Abstract

Hematopoiesis originates in the yolk sac, which forms prior to the establishment of blood circulation and exhibits distinct developmental processes between primates and mice. Despite increasing appreciation of yolk sac hematopoiesis for its lifelong contribution to the adult hematopoietic system and its regulatory roles in organogenesis, cross-species differences, particularly before the onset of blood circulation, remain incompletely understood. In this study, we constructed an integrative cross-species transcriptome atlas of pre-circulation hematopoiesis in humans, monkeys ( Macaca fascicularis), and mice. This analysis identified conserved populations between primates and mice, while also revealing more differentiated myeloid, erythroid, and megakaryocytic lineages in pre-circulation primates compared to mice. Specifically, SPP1-expressing macrophages were detected in primates before the onset of blood circulation but were absent in mice. Cell-cell communication analysis identified CSF1 + extraembryonic mesoderm cells as a potential supportive niche for macrophage generation, with ligand-receptor interactions between macrophages and other cell populations in the human yolk sac. Interestingly, pre-circulation SPP1 + macrophages exhibited hallmark signatures reminiscent of a macrophage subset that positively regulates hematopoietic stem cell generation. Our findings provide a valuable cross-species resource, advancing our understanding of human pre-circulation yolk sac hematopoiesis and offering a theoretical basis for the regeneration of functional blood cells.

最早的造血事件发生于血液循环建立之前的卵黄囊,而卵黄囊的发育过程在物种间存在显著差异。越来越多的证据表明卵黄囊造血能够终生贡献成体造血系统,以及在器官形成过程中发挥调控作用,这凸显了卵黄囊造血的重要性。但对早期卵黄囊造血事件的物种间异同,特别是在血液循环开始之前的具体差异,目前的认识仍相当有限。在该研究中,我们构建了人、食蟹猴和小鼠循环前造血的跨物种转录组整合图谱。物种间比对分析识别了灵长类与小鼠间互相对应的转录组特征相似的造血群体。然而,与小鼠相比,灵长类循环前造血产物中能够观察到更加分化的髓系、巨核和红系造血群体。例如,灵长类在血液循环建立以前已经能够检测到表达 SPP1的巨噬细胞,而小鼠中则没有。细胞间互作分析表明,特异表达 CSF1的卵黄囊胚外中胚层细胞亚群可能为巨噬细胞生成提供了支持微环境。相应地,这群巨噬细胞也可能通过特定的配体-受体互作,介导了对卵黄囊中其他细胞群体的调控。有趣的是,灵长类循环前巨噬细胞群体展现出了与小鼠胚胎背主动脉巨噬细胞亚群相似的分子特征,这些小鼠巨噬细胞被证明能够正向调控造血干细胞产生。综上,我们的研究为理解人类卵黄囊循环前造血发育和功能性血细胞再生提供了新见解。.

Keywords: Hematopoiesis; Integrative analysis; Macrophage; Single-cell RNA sequencing; Yolk sac.


Conflict of interest statement

The authors declare that they have no competing interests.

Figures
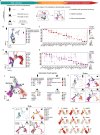
Figure 1
Figure 1
Construction of transcriptome atlas of pre-circulation hematopoiesis across humans, monkeys, and mice at single-cell resolution A: Schematic of cross-species transcriptome integration and comparison of pre-circulation hematopoiesis among humans, monkeys, and mice. CS, Carnegie stage; dpf, days post-fertilization; E, embryonic day; CCA, canonical correlation analysis. B: UMAP visualization of scRNA-seq dataset of hematopoietic-related cells derived from human CS7 embryo. Colors represent cell clusters. ExM, extraembryonic mesoderm; EC, endothelial cell; HPC, hematopoietic progenitor cell; MkP, megakaryocyte progenitor; Ery, erythroblast; MyP, myeloid progenitor; Mac, macrophage. C: Dot plot showing scaled mean expression (color) and proportion of cells expressing genes of cell clusters shown in B from human scRNA-seq dataset. D: UMAP visualization of scRNA-seq dataset of endothelial and hematopoietic-related cells derived from CS8–9 monkey embryos. Colors represent cell clusters. HAB, hemogenic angioblast; HEC, hemogenic endothelial cell. E: Dot plot showing scaled mean expression (color) and proportion (size) of cells expressing genes of cell clusters shown in D from monkey ( in vivo) scRNA-seq dataset. F: UMAP visualization of integrative cross-species transcriptome atlas of pre-circulation yolk sac hematopoiesis. Colors of each dot represent cell clusters. Four major categories were labeled in UMAP (mesoderm; extraembryonic mesoderm, ExM; endothelial cell, EC; hematopoietic populations, including myeloid, megakaryocytic, and erythroid populations). Cell populations in dashed box are cells related to mesoderm and ExM cells. Cells marked by gray background are hematopoietic populations. Mk, megakaryocytic populations; aEC, arterial endothelial cell; Neu, neutrophil; YSEC, yolk sac endothelial cell; hematopoietic-endothelial progenitor, Hema; BP, blood progenitor; EMP, erythromyeloid progenitor. G: UMAP visualization of cells in F divided by datasets. Colors of each dot represent cell clusters in each dataset and share the same cell annotation in F. H: UMAP visualization of cells in F divided by datasets, dot colors in UMAP represent sampling stages of each cell. I: UMAP visualization showing expression levels of indicated genes in integrated datasets.
Figure 2
Figure 2
Cross-species transcriptomic comparison of pre-circulation hematopoiesis A: Heatmap visualization of Pearson correlation coefficients between each pair of cell types across datasets from humans, monkeys ( in vivo and in vitro), and mice. Colors represent Pearson correlation coefficients. Hierarchical clustering of cell clusters from integrative cross-species atlas, based on Euclidean distance, is shown on the top of the heatmap. B: Violin plots showing signature scores based on top 60 DEGs between progenitors during the first (BP, left panel) and second (EMP, right panel) hematopoietic wave of the yolk sac in cell clusters from human and monkey datasets. For box plots within each violin plot, center black lines indicate median values, boxes range from the 25th to 75th percentiles. ns: Not significant; **: P<0.01; ***: P<10 -8. C: Pseudotime trajectory showing molecular progression from mesoderm precursors to myeloid (green), megakaryocytic (blue), and erythroid (red) cells (diff. is abbreviation of differentiation). Common precursors (yellow) indicate shared cells in both myeloid and megakaryocytic differentiation. Arrowhead indicates common root point of three hematopoietic trajectories for downstream distribution analysis. D: Ridge plots showing cross-species distribution along pseudotime orders of myeloid (green), megakaryocytic (blue), and erythroid differentiation (red). Colors represent species. While human (CS7) and monkey (CS8–9) datasets were from pre-circulation embryos, the mouse dataset included both pre-circulation (E6.75–E8.0) and post-circulation (E8.25–E8.5) embryos. Dashed lines represent end point of mouse pre-circulation distribution. E: Dot plot showing scaled mean expression (color) and proportion (size) of cells expressing myeloid-related DEGs of human HPC, monkey ( in vivo) HPC2, and mouse EMP. Pre-macrophage feature genes are labeled in red.
Figure 3
Figure 3
Cell-cell communication analysis of cross-talk between SPP1 + Mac and other populations in human yolk sac A: UMAP visualization of co-expression levels of SPP1 and C1QC in scRNA-seq datasets of humans, monkeys ( in vivo and in vitro), and mice, respectively. B: UMAP visualization showing comparative view of expression levels of macrophage-related genes ( CD86, CD163, HLA-DMB, TLR1, MAF, and MAFB) between primates and mice. C: Network plot showing scaled interaction weight between macrophages and other clusters in human CS7 yolk sac, predicted by CellChat. D: Dot plot showing contribution probability of outgoing ligand-receptor signaling from each human yolk sac cell population in C. Sizes of each dot represent contribution probability, while colors represent cell clusters. E: Heatmap showing importance scores of cell populations from human yolk sac in C contributing to CSF and CCL signaling. In CSF signaling, ExM cells play an exclusive sender role, while macrophages are the major receiver. In CCL signaling, macrophages are the major sender and receiver, indicating a self-regulatory pattern. F: UMAP visualization of the distribution of CD24-expressing and CSF1-expressing subsets of ExM cells from human yolk sac dataset. Dot colors represent newly defined cell clusters, gray dots other cell populations. G: Dot plot showing average expression (color) and proportion (size) of cells expressing top DEGs between CD24 + ExM and CSF1 + ExM cells. H: Violin plot showing cell orders ranked by differentiation state (1 to 0 represent less-differentiation to more-differentiation states) predicted by cytoTRACE. For box plots within each violin plot, center black lines indicate median values, boxes range from 25th to 75th percentiles. ***: P<10 -8. I: Dot plot showing communication probability (dot color) and P-value (dot size) of indicated ligand-receptor interactions between macrophages (sender) and other cell populations (receptor) in C. J: Heatmap visualization of expression levels of ligand and receptor genes in I. K: Violin plot showing expression levels of CSF1R, CX3CR1, and MRC1 (encoding CD206) in myeloid-related cell clusters in human dataset. L: Heatmap visualization of expression levels of gene sets related to pro-inflammatory signaling (from Hallmark) in cell clusters from human yolk sac. M: Bar plot showing proportions of sampling stages in each myeloid population from Bian et al. ( 2020). Macrophages (Mac) were sampled from yolk sac (CS11-CS17), blood (CS13-CS20), liver (CS12-CS23), lung (CS20 and CS23), skin (CS20 and CS23), and head (CS11-CS23). YSMP, yolk sac-derived myeloid-biased progenitor; GMP, granulocyte–monocyte progenitor. N: Violin plot showing expression level of SPP1 gene in myeloid-related cell clusters in M. Statistical testing was performed between indicated pairs of cell clusters (YS_Mac1 and YS_Mac2, Head_Mac1 and Head_Mac2, Head_Mac2 and Head_Mac3, Head_Mac3 and Head_Mac4). ns: Not significant; **: P<0.01; ***: P<10 -8.
Figure 4
Figure 4
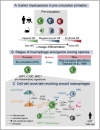
Schematic showing earlier myelopoiesis and occurrence of macrophages in primates versus mice before blood circulation onset A: Gradient of colors in different cell populations, including myeloid, megakaryocyte, and erythroid lineages, showing earlier myelopoiesis in primates compared to mice before blood circulation onset (less-diff. and more-diff. represent less- and more-differentiated states, respectively). B: Earlier occurrence of macrophages in primates but not in mice before blood circulation onset. C: Potential cell-cell cross talk between SPP1 + macrophages and other cellular components in human CS7 yolk sac.

Similar articles

References

    1. Aziz A, Soucie E, Sarrazin S, et al MafB/c-Maf deficiency enables self-renewal of differentiated functional macrophages. Science. 2009;326(5954):867–871. doi: 10.1126/science.1176056. - DOI - PubMed
    1. Bian ZL, Gong YD, Huang T, et al Deciphering human macrophage development at single-cell resolution. Nature. 2020;582(7813):571–576. doi: 10.1038/s41586-020-2316-7. - DOI - PubMed
    1. Calvanese V, Capellera-Garcia S, Ma FY, et al Mapping human haematopoietic stem cells from haemogenic endothelium to birth. Nature. 2022;604(7906):534–540. doi: 10.1038/s41586-022-04571-x. - DOI - PMC - PubMed
    1. Calvanese V, Mikkola HKA The genesis of human hematopoietic stem cells. Blood. 2023;142(6):519–532. doi: 10.1182/blood.2022017934. - DOI - PMC - PubMed
    1. Canu G, Ruhrberg C First blood: the endothelial origins of hematopoietic progenitors. Angiogenesis. 2021;24(2):199–211. doi: 10.1007/s10456-021-09783-9. - DOI - PMC - PubMed