. 2025 Feb 20;231(2):e277-e289.
doi: 10.1093/infdis/jiae491.

Transcriptomic Biomarkers Associated With Microbiological Etiology and Disease Severity in Childhood Pneumonia

Collaborators, Affiliations

Transcriptomic Biomarkers Associated With Microbiological Etiology and Disease Severity in Childhood Pneumonia

Derek J Williams et al. J Infect Dis. .

Abstract

Background: Challenges remain in discerning microbiologic etiology and disease severity in childhood pneumonia. Defining host transcriptomic profiles during illness may facilitate improved diagnostic and prognostic approaches.

Methods: Using whole blood RNA sequencing from 222 hospitalized children with radiographic pneumonia and 45 age-matched controls, we identified differentially expressed (DE) genes that best identified children according to detected microbial pathogens (viral only vs bacterial only and typical vs atypical bacterial [with or without [±] viral co-detection]) and an ordinal measure of phenotypic severity (moderate, severe, very severe).

Results: Overall, 135 (61%) children had viral-only detections, 15 (7%) had typical bacterial detections (± viral co-detections), and 26 (12%) had atypical bacterial detections (± viral co-detections). Eleven DE genes distinguished between viral-only and bacterial-only detections. Sixteen DE genes distinguished between atypical and typical bacterial detections (± viral co-detections). Nineteen DE genes distinguished between levels of pneumonia severity, including 4 genes also identified in the viral-only versus bacterial-only model (IGHGP, PI3, CD177, RAP1GAP1) and 4 genes from the typical versus atypical bacterial model (PRSS23, IFI27, OLFM4, ABO).

Conclusions: We identified transcriptomic biomarkers associated with microbial detections and phenotypic severity in children hospitalized with pneumonia. These DE genes are promising candidates for validation and translation into diagnostic and prognostic tools.

Keywords: bacterial; pneumonia; severity scores; transcriptomics; viral.


Conflict of interest statement

Potential conflicts of interest . D. J. W. reports in-kind research support from bioMérieux for unrelated work. C. B. C. reports serving as a consultant to Pfizer, Moderna, GSK, and Vir for unrelated work. K. M. E. has received grant funding from the NIH and the CDC; has served as a consultant to Bionet and IBM; and has been a member of the data safety and monitoring board for Sanofi, X-4 Pharma, Seqirus, Moderna, Pfizer, Merck, Roche, and CEPI. O. R. reports research grant support to his institution from Janssen, Merck, NIH, and the Gates Foundation; and fees for participation in advisory boards from Sanofi Pasteur, Merck, Lilly, Adagios, and Pfizer and for lectures from Pfizer, Sanofi Pasteur, and AstraZeneca. E. J. A. receives compensation from Moderna and has consulted for Pfizer, Sanofi Pasteur, GSK, Janssen, and Medscape; serves on safety monitoring boards for Kentucky BioProcessing and Sanofi Pasteur; and serves on a data adjudication board for WCG and ACI Clinical. His institution receives funds to conduct clinical research, unrelated to this work, from MedImmune, Regeneron, PaxVax, Pfizer, GSK, Merck, Sanofi Pasteur, Janssen, and Micron, and his institution has also received funding from NIH to conduct clinical trials of COVID-19 vaccines. S. R. A. reports research grant support to her institution unrelated to this work from Pfizer, Moderna, Contrafect, and Enanta. All other authors report no potential conflicts. All authors have submitted the ICMJE Form for Disclosure of Potential Conflicts of Interest. Conflicts that the editors consider relevant to the content of the manuscript have been disclosed.

Figures

Figure 1.
Figure 1.
Summary of differentially expressed (DE) genes in children hospitalized with pneumonia vs healthy controls, overall and by pathogen group. The heatmap displays log2 counts per million comparing viral, typical bacterial, atypical bacterial, and unknown pneumonia etiologies to the healthy control cohort, adjusted for sex and age. Rows represent the union of all DE genes shared across the 4 pneumonia groups compared to healthy controls and columns represent individual observations, ordered by etiologic grouping. Blue to red gradient represents low to high z-score values. Dendrograms were obtained using complete linkage clustering of uncentered pairwise Pearson correlation distances between standardized log2-fold changes. The upset plot summarizes the overlap in DE genes between pathogen groups. The horizontal bar plot shows the total number of DE genes for each group and the adjacent filled circles represent unique and overlapping (connected circles) DE genes. The Venn diagram summarizes overlap in DE genes across known pathogen groups and unknown etiologies, with upregulated DE genes represented in red and downregulated DE genes in blue. Abbreviations: DE, differentially expressed; LCPM, log2 counts per million; SDEG, signficant differentially expressed gene.
Figure 2.
Figure 2.
Radar plot displaying the top enriched KEGG, MSigDB Reactome, and MSigDB Gene Ontology (GO) Biological Process gene sets. The top pathways represent those with the greatest difference between etiologies in terms of enrichment score followed by Jaccard index. The distance from the center represents the enrichment score of the differentially expressed genes in the viral pneumonia cohort (blue line), typical bacterial cohort (yellow line), and atypical bacterial cohort (red line). Abbreviations: IFN, interferon; IgA, immunoglobulin A; PD-1, programmed cell death one; rRNA, ribosomal RNA; TNF, tumor necrosis factor; tRNA, transfer RNA.
Figure 3.
Figure 3.
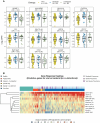
Boxplots (A) and heatmap (B) of differentially expressed (DE) genes predicting viral vs bacterial etiology. To identify gene expression signatures that best predicted viral vs bacterial (without co-detection) infection, a lasso-regularized logistic regression model was fit using the gene expression profiles of the DE genes identified in the typical bacteria, atypical bacterial, and viral-only pathogen cohorts. Box plots and heatmap represent gene expression, quantified as log2 counts per million. Odds ratios in (A) reflect the relative change in odds for viral-only vs bacterial-only etiology associated with a unit change in gene expression. Gene descriptions are listed in Table 2. Abbreviations: CPM, counts per million; LCPM, log2 counts per million; OR, odds ratio.
Figure 4.
Figure 4.
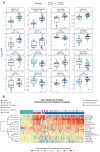
Boxplots (A) and heatmap (B) of differentially expressed (DE) genes predicting typical vs atypical bacterial etiology. To identify gene expression signatures that best predicted typical vs atypical bacterial infection, a lasso-regularized logistic regression model was fit using the gene expression profiles of the DE genes identified in the typical bacteria, atypical bacterial, and viral-only pathogen cohorts. Boxplots and heatmap represent gene expression, quantified as log2 counts per million. Odds ratios reflect the relative change in odds for typical vs atypical bacterial etiology associated with a unit change in gene expression. Gene descriptions are listed in Table 2. Abbreviations: CPM, counts per million; LCPM, log2 counts per million; OR, odds ratio.
Figure 5.
Figure 5.
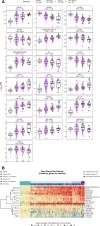
Boxplots (A) and heatmap (B) of differentially expressed genes predicting pneumonia severity. To identify gene expression signatures that best predicted illness severity defined on an ordinal severity scale (very severe, severe, moderate and healthy), a lasso-regularized ordinal regression model was used. Box plots and heatmap represent gene expression, quantified as log2 counts per million. Odds ratios reflect the relative change in odds for a more severe outcome associated with a unit change in gene expression. Gene descriptions are listed in Table 2. Abbreviations: B, gene represented in typical vs atypical bacterial model; CPM, counts per million; LCPM, log2 counts per million; OR, odds ratio; S, gene represented in severity model; V, gene represented in viral vs bacterial model.

References

    1. Jain S, Williams DJ, Arnold SR, et al. Community-acquired pneumonia requiring hospitalization among U.S. children. N Engl J Med 2015; 372:835–45. - PMC - PubMed
    1. Harris AM, Bramley AM, Jain S, et al. Influence of antibiotics on the detection of bacteria by culture-based and culture-independent diagnostic tests in patients hospitalized with community-acquired pneumonia. Open Forum Infect Dis 2017; 4:ofx014. - PMC - PubMed
    1. Myers AL, Hall M, Williams DJ, et al. Prevalence of bacteremia in hospitalized pediatric patients with community-acquired pneumonia. Pediatr Infect Dis J 2013; 32:736–40. - PMC - PubMed
    1. Shah SS, Dugan MH, Bell LM, et al. Blood cultures in the emergency department evaluation of childhood pneumonia. Pediatr Infect Dis J 2011; 30:475–9. - PMC - PubMed
    1. Bradley JS, Byington CL, Shah SS, et al. The management of community-acquired pneumonia in infants and children older than 3 months of age: clinical practice guidelines by the Pediatric Infectious Diseases Society and the Infectious Diseases Society of America. Clin Infect Dis 2011; 53:e25–76. - PMC - PubMed