. 2025 Apr 3;148(4):1374-1388.
doi: 10.1093/brain/awae321.

Schizophrenia-associated changes in neuronal subpopulations in the human midbrain

Affiliations

Schizophrenia-associated changes in neuronal subpopulations in the human midbrain

Astrid M Alsema et al. Brain. .

Abstract

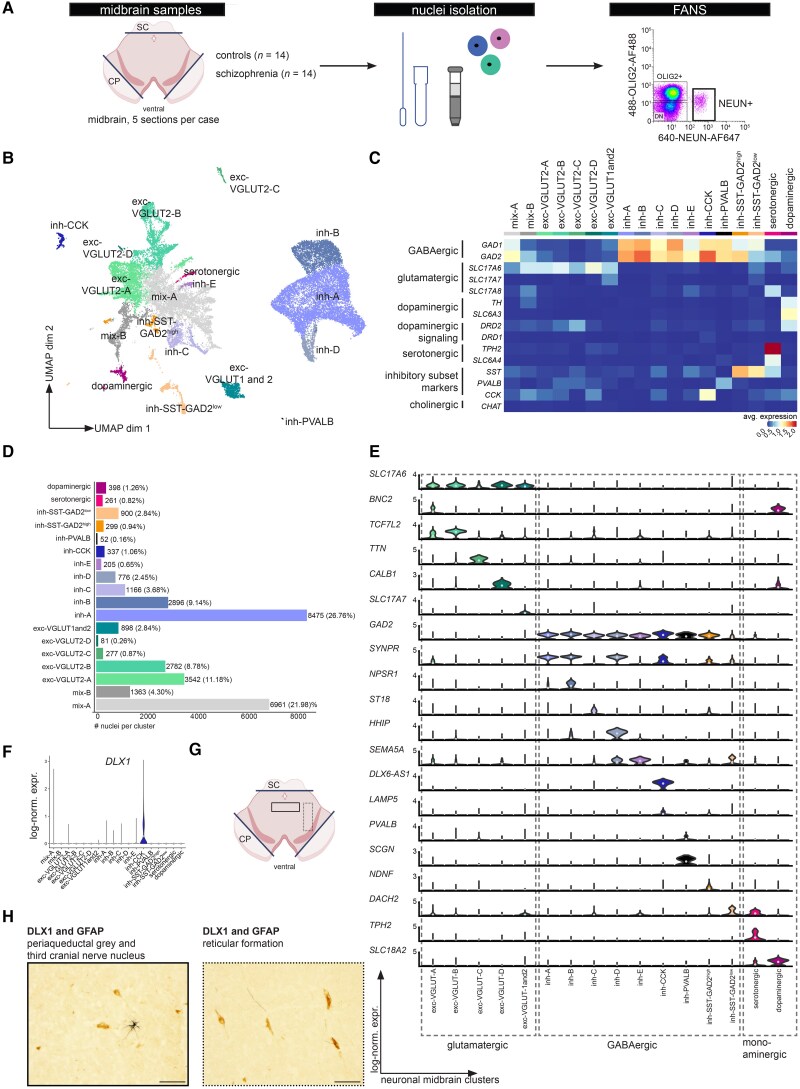
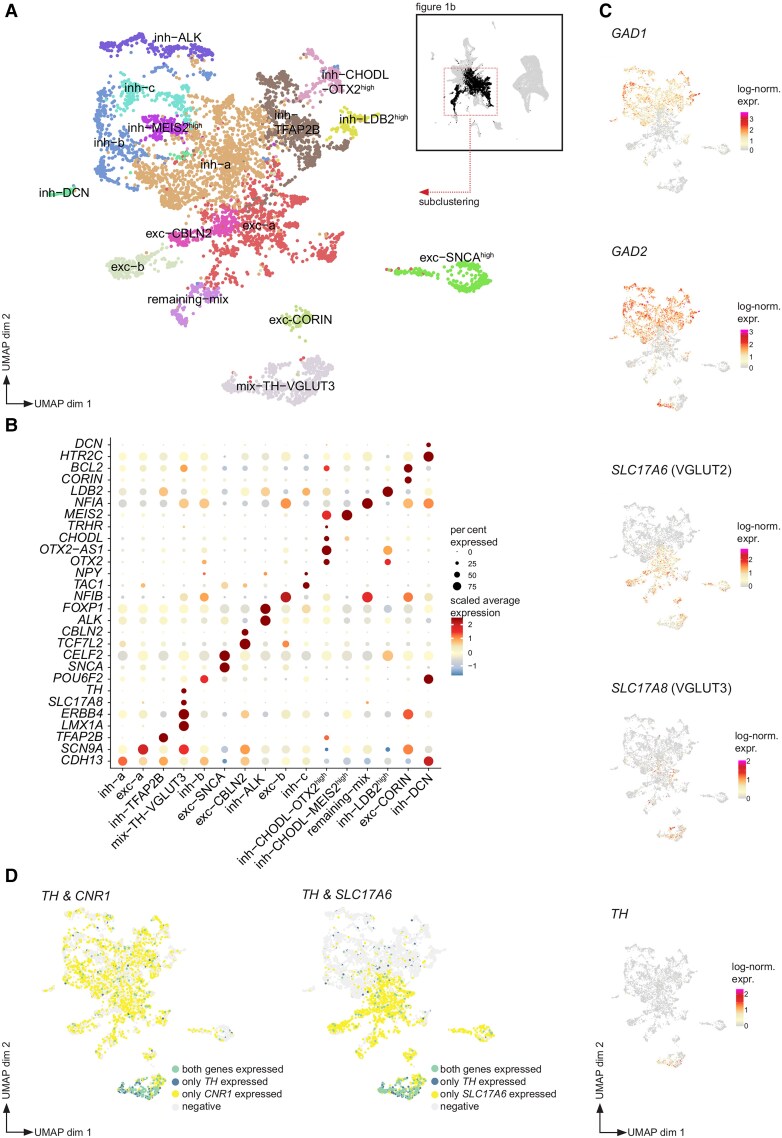
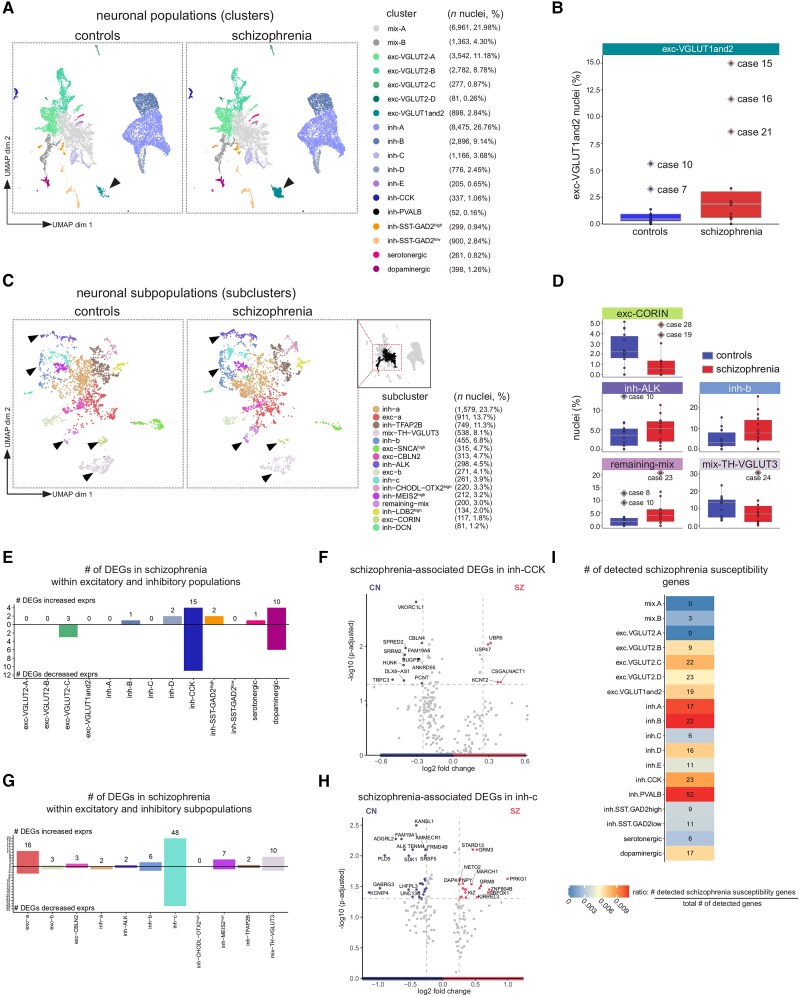
Dysfunctional GABAergic and dopaminergic neurons are thought to exist in the ventral midbrain of patients with schizophrenia, yet transcriptional changes underpinning these abnormalities have not yet been localized to specific neuronal subsets. In the ventral midbrain, control over dopaminergic activity is maintained by both excitatory (glutamate) and inhibitory (GABA) input neurons. To elucidate neuron pathology at the single-cell level, we characterized the transcriptional diversity of distinct NEUN+ populations in the human ventral midbrain and then tested for schizophrenia-associated changes in neuronal subset proportions and gene activity changes within neuronal subsets. Combining single nucleus RNA-sequencing with fluorescence-activated sorting of NEUN+ nuclei, we analysed 31 669 nuclei. Initially, we detected 18 transcriptionally distinct neuronal populations in the human ventral midbrain, including two 'mixed' populations. The presence of neuronal populations in the midbrain was orthogonally validated with immunohistochemical stainings. 'Mixed' populations contained nuclei expressing transcripts for vesicular glutamate transporter 2 (SLC17A6) and glutamate decarboxylase 2 (GAD2), but these transcripts were not typically co-expressed by the same nucleus. Upon more fine-grained subclustering of the two 'mixed' populations, 16 additional subpopulations were identified that were transcriptionally classified as excitatory or inhibitory. In the midbrains of individuals with schizophrenia, we observed potential differences in the proportions of two (sub)populations of excitatory neurons, two subpopulations of inhibitory neurons, one 'mixed' subpopulation, and one subpopulation of TH-expressing neurons. This may suggest that transcriptional changes associated with schizophrenia broadly affect excitatory, inhibitory, and dopamine neurons. We detected 99 genes differentially expressed in schizophrenia compared to controls within neuronal subpopulations identified from the two 'mixed' populations, with most (67) changes within small GABAergic neuronal subpopulations. Overall, single-nucleus transcriptomic analyses profiled a high diversity of GABAergic neurons in the human ventral midbrain, identified putative shifts in the proportion of neuronal subpopulations, and suggested dysfunction of specific GABAergic subpopulations in schizophrenia, providing directions for future research.

Keywords: midbrain; neurons; schizophrenia; single-nucleus RNA sequencing.


Conflict of interest statement

The authors report no competing interests.

Figures

Figure 1
Figure 1
Unsupervised clustering identifies 18 neuronal populations in the human midbrain. (A) Experimental design of the study (Supplementary Table 1). A schematic representation of the rostral midbrain at the level of the red nucleus and third cranial nerves (created with biorender.com). The lines indicate where the superior colliculus (SC) and cerebral peduncles (CP) were removed before nuclei isolation, FANS and snRNAseq. (B) Unsupervised clustering of 31 669 neuronal nuclei from 14 schizophrenia (SZ) cases and 14 controls (Supplementary Tables 2 and 3). Each dot indicates a nucleus, colours indicate clusters. (C) Average expression per cluster of selected neurotransmitter-, neuropeptide- or interneuron-related genes. (D) Bar plot depicting the total number of nuclei obtained per population, with the percentage of the total NEUN+ population enclosed in parentheses. (E) Violin plots depicting log-normalized expression levels of cluster markers (log2 fold-change > 0.25, P-adjusted < 0.05) (Supplementary Table 3). (F) Violin plot depicting log-normalized expression level of DLX1, a cluster marker for inh-CCK. (G) A schematic representation of the rostral midbrain indicating the periaqueductal grey and the third cranial nerve nucleus with a box and the reticular formation with a dotted box. In these regions the immunohistochemical staings, shown in H, were performed. (H) Representative images of immunohistochemical stainings for DLX1 (brown) and GFAP (black) in control midbrain (n = 5). Scale bar = 50 μm. avg. = average; expr. = expression; FANS = fluorescence-activated nuclear sorting; log-norm. = log-normalized; snRNAseq = single nucleus RNA-sequencing; UMAP = Uniform Manifold Approximation and Projection.
Figure 2
Figure 2
Subclustering of mixed clusters identifies 16 additional neuronal subpopulations. (A) Unsupervised subclustering of 6654 nuclei corresponding to mix-A and mix-B. Each dot indicates a nucleus, and colours indicate subclusters (Supplementary Tables 7 and 8). (B) Dot plot depicting marker genes per subcluster. Size of the circles indicates the percentage of nuclei expressing the gene, colour indicates the scaled average gene expression (Supplementary Table 8). (C) Uniform Manifold Approximation and Projection (UMAP) depicting the expression of neurotransmitter-related genes (GAD1, GAD2, SLC17A6, SLC17A8, TH). Colour indicates log-normalized gene expression. (D) UMAPs depicting the co-expression of TH and CNR1 (left) and TH and SLC17A6 (right). expr. = expression; log-norm = log-normalized.
Figure 3
Figure 3
Schizophrenia-associated shifts in proportions of midbrain neuronal populations and subpopulations. (A) Uniform Manifold Approximation and Projection (UMAP) of the clusters split by diagnosis. The colour legend indicates the number of nuclei obtained per population and the percentage of the total NEUN+ population enclosed in brackets. (B) Box plot depicting the percentage of exc-VGLUT1 and 2 nuclei detected in midbrain samples of schizophrenia and control cases (n = 14 per group; Supplementary Table 10). Outlier cases are labelled with grey diamond shapes, each dot represents a case, and horizontal lines indicate the median. Outliers were defined as proportions outside of the third quartile plus 1.5 times the interquartile range. (C) UMAP of the subclusters split by diagnosis. The colour legend indicates the number of nuclei obtained per population and the percentage of the total NEUN+ population enclosed in brackets. (D) Box plots depicting the percentage of nuclei detected per case in subclusters that had significantly altered proportions in schizophrenia; Supplementary Tables 10 and 12. Outlier cases are labelled with grey diamond shapes and were defined as data points outside the third quartile + 1.5 × interquartile range. (E) Total count of differentially expressed genes (DEGs) between schizophrenia and controls within a neuronal population. Numbers above the bar indicate the total count of increased plus decreased gene expression changes in schizophrenia. (F) Volcano plot depicting differentially expressed genes (absolute log2 fold-change > 0.25, P-adjusted < 0.05) between schizophrenia and controls within the neuronal population ‘inh-CCK’. The corresponding information on DEGs is available in Supplementary Table 13. (G) Total count of differentially expressed genes between schizophrenia and controls within a neuronal subpopulation. Numbers above the bar indicate the total count of increased plus decreased gene expression changes in schizophrenia. (H) Volcano plot depicting DEGs (absolute log2 fold-change > 0.25, P-adjusted < 0.05) between schizophrenia and controls within the neuronal subpopulation ‘inh-C’. The number of gene labels was reduced to avoid overlapping text; the full information on DEGs is available in Supplementary Table 14. (I) Heat map with the number indicating the detected schizophrenia susceptibility genes per neuronal population (Supplementary Table 16). The colour indicates the normalized ratio of detected susceptibility genes over the total number of expressed genes per neuronal population. High-confidence schizophrenia susceptibility genes derived from Wang et al.

Similar articles

References

    1. Kahn RS, Sommer IE. The neurobiology and treatment of first-episode schizophrenia. Mol Psychiatry. 2015;20:84–97. - PMC - PubMed
    1. Gandal MJ, Zhang P, Hadjimichael E, et al. Transcriptome-wide isoform-level dysregulation in ASD, schizophrenia, and bipolar disorder. Science. 2018;362:eaat8127. - PMC - PubMed
    1. Kim M, Haney JR, Zhang P, et al. Brain gene co-expression networks link complement signaling with convergent synaptic pathology in schizophrenia. Nat Neurosci. 2021;24:799–809. - PMC - PubMed
    1. Trubetskoy V, Pardiñas AF, Qi T, et al. Mapping genomic loci implicates genes and synaptic biology in schizophrenia. Nature. 2022;604:502–508. - PMC - PubMed
    1. Skene NG, Bryois J, Bakken TE, et al. Genetic identification of brain cell types underlying schizophrenia. Nat Genet. 2018;50:825–833. - PMC - PubMed

Substances