

Tumor microbiota of renal cell carcinoma affects clinical prognosis by influencing the tumor immune microenvironment
- PMID: 39397906
- PMCID: PMC11470785
- DOI: 10.1016/j.heliyon.2024.e38310
Tumor microbiota of renal cell carcinoma affects clinical prognosis by influencing the tumor immune microenvironment
Abstract
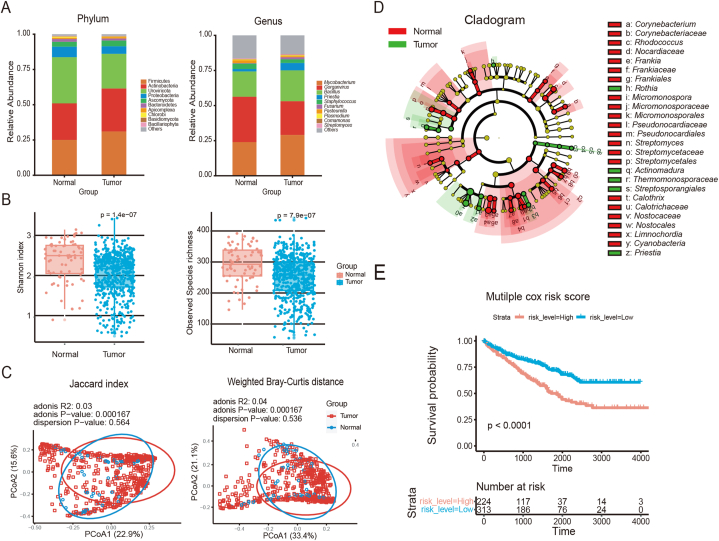
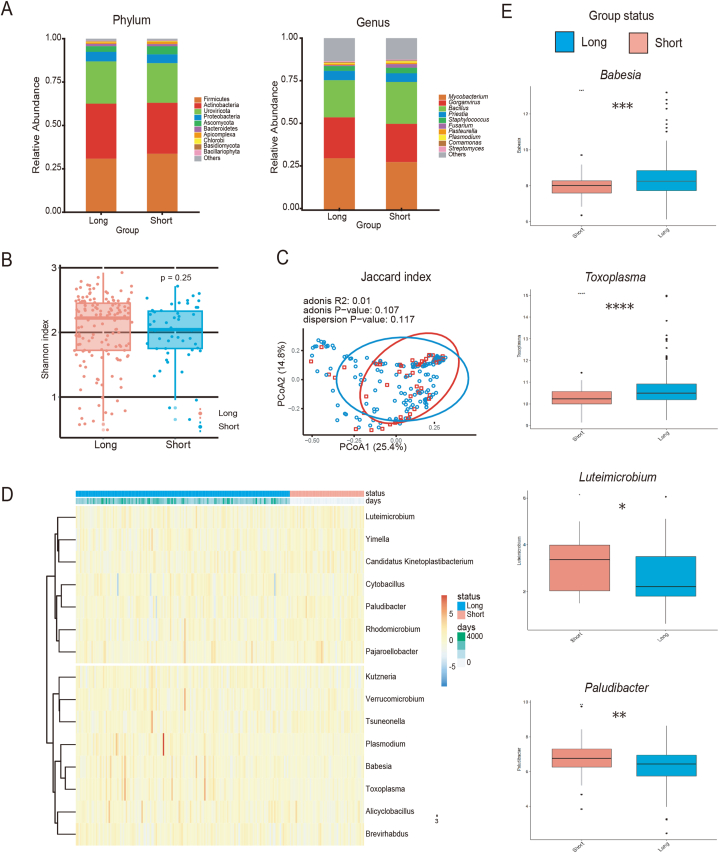
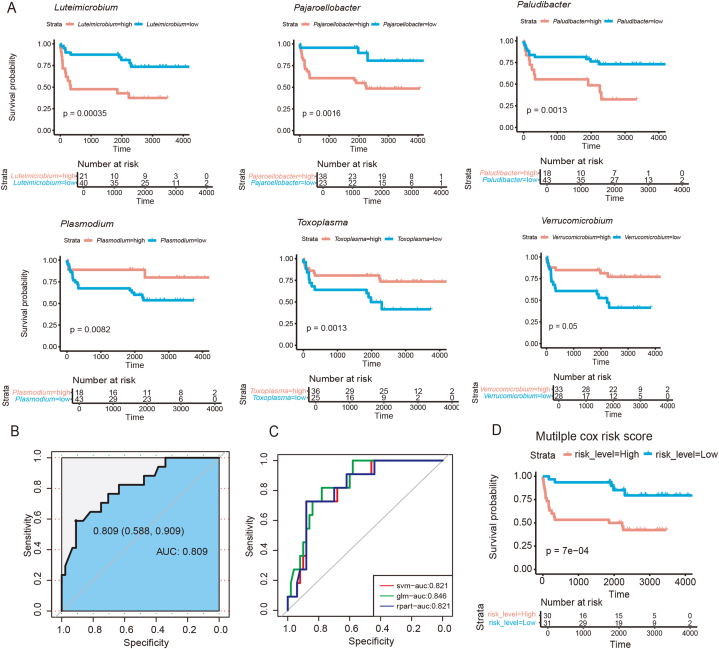
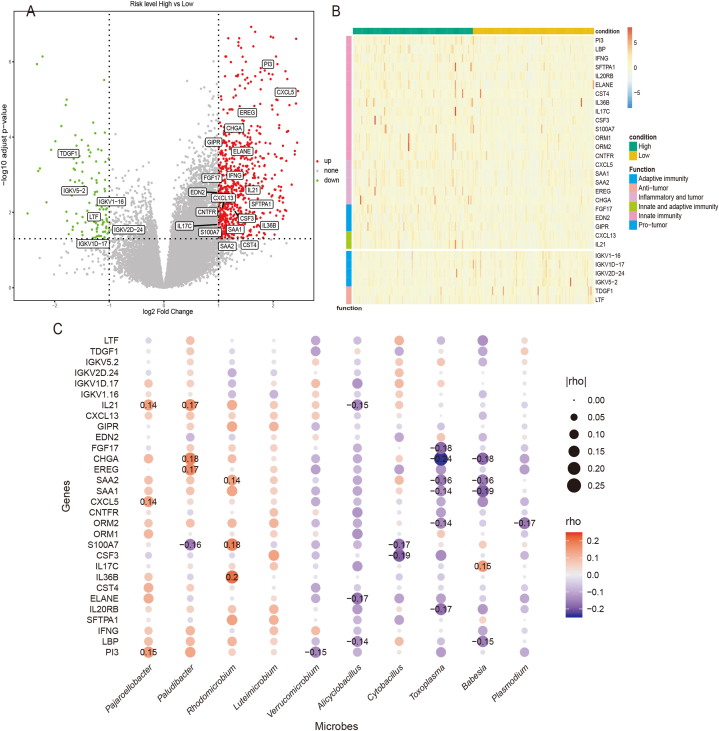
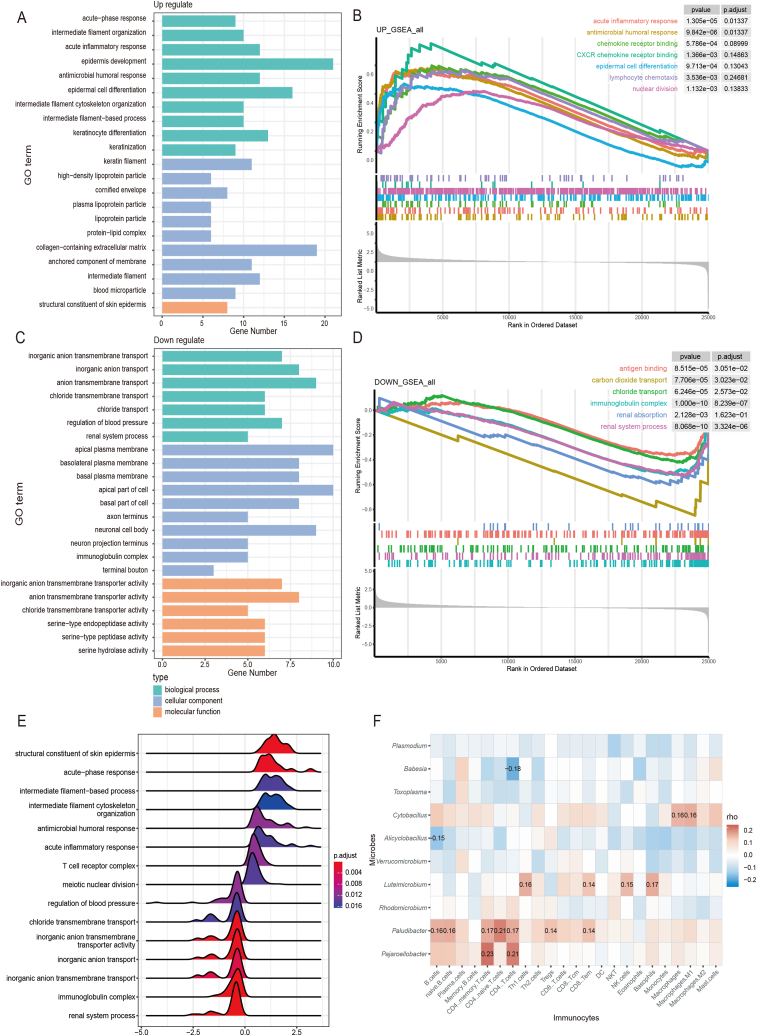
Despite reported influences of the intratumoral microbiome on cancer progression, its role in this subtype remains unclear. This study aimed to characterize the microbial landscape and signatures of kidney renal clear cell carcinoma using RNA-Seq data from The Cancer Genome Atlas. Following microbial decontamination, differential microbial analysis was conducted between tumorous and adjacent non-tumorous samples. Compared to non-tumorous samples, tumorous microbiota exhibited reduced α and β diversity and distinct phylum-level communities. Differential microbial analysis between patients exhibiting long and short overall survival revealed ten significant differential microbial genera, with six genera correlating with a positive prognosis (Plasmodium, Babesia, Toxoplasma, Cytobacillus, Alicyclobacillus, Verrucomicrobium) and four with a negative prognosis (Colletotrichum, Leuconostoc, Gluconobacter, and Parabacteroides). Employing Cox regression analysis and support vector machines, a prognosis-related microbiome risk signature was developed, achieving an AUC of 0.809. Based on this risk signature, two microbiome-based subtypes were found to be significantly associated with distinct clinical prognoses and immune microenvironments. These findings were corroborated by significant correlations between prognostic-relevant microorganisms and 30 immune-related differentially expressed genes. Specifically, microbial genera associated with a negative prognosis were linked to a pro-tumor acute inflammatory immune response, whereas genera related to a positive prognosis were associated with an anti-tumor adaptive immune response. In conclusion, microbiome-based subtyping revealed correlations between tumor microbiome, clinical prognosis, and tumor microenvironment, indicating intratumoral microbiota as a promising prognostic biomarker for kidney renal clear cell carcinoma.
Keywords: Biomarkers; Intratumor microbiota; Kidney renal clear cell carcinoma; Tumor microenvironment.
© 2024 The Authors.
Conflict of interest statement
The authors declare that they have no known competing financial interests or personal relationships that could have appeared to influence the work reported in this paper.
Figures
Similar articles
-
Intratumoral microbiota of pancreatic ductal adenocarcinoma impact patient prognosis by influencing tumor microenvironment.Discov Oncol. 2024 Sep 13;15(1):443. doi: 10.1007/s12672-024-01320-6. Discov Oncol. 2024. PMID: 39271584 Free PMC article.
-
The Interaction between Intratumoral Microbiome and Immunity Is Related to the Prognosis of Ovarian Cancer.Microbiol Spectr. 2023 Mar 28;11(2):e0354922. doi: 10.1128/spectrum.03549-22. Online ahead of print. Microbiol Spectr. 2023. PMID: 36975828 Free PMC article.
-
Intratumoral Microbiota Changes with Tumor Stage and Influences the Immune Signature of Oral Squamous Cell Carcinoma.Microbiol Spectr. 2023 Aug 17;11(4):e0459622. doi: 10.1128/spectrum.04596-22. Epub 2023 Jul 6. Microbiol Spectr. 2023. PMID: 37409975 Free PMC article.
-
A novel necroptosis-related gene index for predicting prognosis and a cold tumor immune microenvironment in stomach adenocarcinoma.Front Immunol. 2022 Oct 27;13:968165. doi: 10.3389/fimmu.2022.968165. eCollection 2022. Front Immunol. 2022. PMID: 36389725 Free PMC article. Review.
-
The emerging tumor microbe microenvironment: From delineation to multidisciplinary approach-based interventions.Acta Pharm Sin B. 2024 Apr;14(4):1560-1591. doi: 10.1016/j.apsb.2023.11.018. Epub 2023 Nov 15. Acta Pharm Sin B. 2024. PMID: 38572104 Free PMC article. Review.
Cited by
-
Research progress on intratumoral microorganisms in renal cancer.World J Urol. 2025 Jan 15;43(1):72. doi: 10.1007/s00345-024-05403-5. World J Urol. 2025. PMID: 39812826 Review.
-
Microbiota and urinary tumor immunity: Mechanisms, therapeutic implications, and future perspectives.Chin J Cancer Res. 2024 Dec 30;36(6):596-615. doi: 10.21147/j.issn.1000-9604.2024.06.03. Chin J Cancer Res. 2024. PMID: 39802902 Free PMC article. No abstract available.
-
Comprehensive analysis of the interaction microbiome and prostate cancer: an initial exploration from multi-cohort metagenome and GWAS studies.J Transl Med. 2025 Jan 29;23(1):130. doi: 10.1186/s12967-024-05937-7. J Transl Med. 2025. PMID: 39881417 Free PMC article.
References
-
- Powles T., Staehler M., Ljungberg B., Bensalah K., Canfield S.E., Dabestani S., Giles R.H., Hofmann F., Hora M., Kuczyk M.A., Lam T., Marconi L., Merseburger A.S., Volpe A., Bex A. European association of urology guidelines for clear cell renal cancers that are resistant to vascular endothelial growth factor receptor-targeted therapy. Eur. Urol. 2016;70(5):705–706. doi: 10.1016/j.eururo.2016.06.009. - DOI - PubMed
-
- Zhou J., Luo J., Wu K., Yun E.J., Kapur P., Pong R.C., Du Y., Wang B., Authement C., Hernandez E., Yang J., Xiao G., Cha T.L., Wu H.C., Wu D., Margulis V., Lotan Y., Brugarolas J., He D., Hsieh J.T. Loss of DAB2IP in RCC cells enhances their growth and resistance to mTOR-targeted therapies. Oncogene. 2016;35(35):4663–4674. doi: 10.1038/onc.2016.4. - DOI - PubMed
-
- McDermott D.F., Regan M.M., Clark J.I., Flaherty L.E., Weiss G.R., Logan T.F., Kirkwood J.M., Gordon M.S., Sosman J.A., Ernstoff M.S., Tretter C.P., Urba W.J., Smith J.W., Margolin K.A., Mier J.W., Gollob J.A., Dutcher J.P., Atkins M.B. Randomized phase III trial of high-dose interleukin-2 versus subcutaneous interleukin-2 and interferon in patients with metastatic renal cell carcinoma. J. Clin. Oncol. 2005;23(1):133–141. doi: 10.1200/jco.2005.03.206. - DOI - PubMed
LinkOut - more resources
Full Text Sources
