

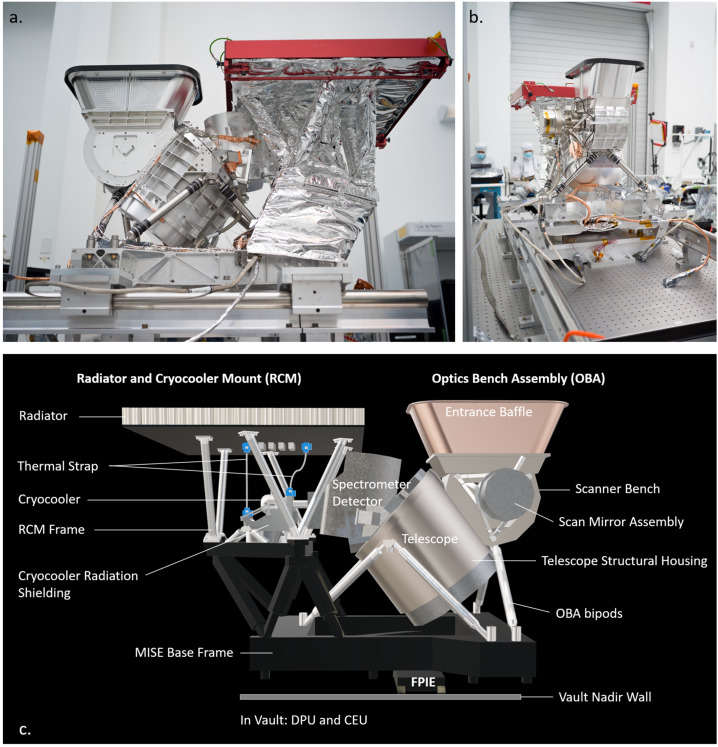
The Mapping Imaging Spectrometer for Europa (MISE)
- PMID: 39398102
- PMCID: PMC11464581
- DOI: 10.1007/s11214-024-01097-8
The Mapping Imaging Spectrometer for Europa (MISE)
Abstract
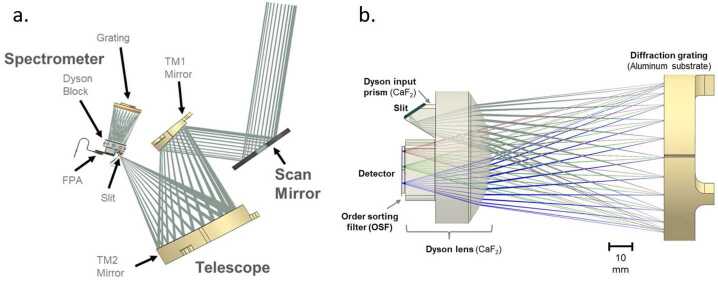
The Mapping Imaging Spectrometer for Europa (MISE) is an infrared compositional instrument that will fly on NASA's Europa Clipper mission to the Jupiter system. MISE is designed to meet the Level-1 science requirements related to the mission's composition science objective to "understand the habitability of Europa's ocean through composition and chemistry" and to contribute to the geology science and ice shell and ocean objectives, thereby helping Europa Clipper achieve its mission goal to "explore Europa to investigate its habitability." MISE has a mass of 65 kg and uses an energy per flyby of 75.2 W-h. MISE will detect illumination from 0.8 to 5 μm with 10 nm spectral resolution, a spatial sampling of 25 m per pixel at 100 km altitude, and 300 cross-track pixels, enabling discrimination among the two principal states of water ice on Europa, identification of the main non-ice components of interest: salts, acids, and organics, and detection of trace materials as well as some thermal signatures. Furthermore, the spatial resolution and global coverage that MISE will achieve will be complemented by the higher spectral resolution of some Earth-based assets. MISE, combined with observations collected by the rest of the Europa Clipper payload, will enable significant advances in our understanding of how the large-scale structure of Europa's surface is shaped by geological processes and inform our understanding of the surface at microscale. This paper describes the planned MISE science investigations, instrument design, concept of operations, and data products.
Keywords: Composition; Europa; Europa Clipper; Mapping; Spectrometer.
© The Author(s) 2024.
Conflict of interest statement
Competing InterestsThe authors have no competing interests to declare that are relevant to the content of this article.
Figures
References
-
- Abramov O, Spencer JR (2008) Numerical modeling of endogenic thermal anomalies on Europa. Icarus 195(1):378–385
-
- Becker TM, Trumbo SK, Molyneux PM, Retherford KD, Hendrix AR, Roth L, Raut U, Alday J, McGrath MA (2022) Mid-ultraviolet Hubble observations of Europa and the global surface distribution of SO2. J Geomagn Geoelectr 3(6):129. 10.3847/PSJ/ac69eb - DOI
-
- Becker TM, Zolotov M, Gudipati MS, et al. (2024) Exploring the composition of Europa with the upcoming Europa Clipper Mission. Space Sci Rev 220:49. 10.1007/s11214-024-01069-y - DOI
-
- Belton MJS, Head JW III, Ingersoll AP, Greeley R, McEwen AS, Klaasen KP, Senske D, Pappalardo R, Collins G, Vasavada AR, Sullivan R, Simonelli D, Geissler P, Carr MH, Davies ME, Veverka J, Gierasch PJ, Banfield D, Bell M, Chapman CR, Anger C, Greenberg R, Neukum G, Pilcher CB, Beebe RF, Burns A, Fanale F, Ip W, Johnson TV, Morrison D, Moore J, Orton GS, Thomas P, West RA (1996) Galileo’s first images of Jupiter and the Galilean satellites. Science 274:377–385 - PubMed
-
- Bender HA, Blaney DL, Mouroulis P, Moore LA, Van Gorp BE (2019) Optical design of the mapping imaging spectrometer for Europa (MISE). In: Proc. SPIE 11130, imaging spectrometry XXIII: applications, sensors, and processing, p 111300C. 10.1117/12.2530464
Publication types
LinkOut - more resources
Full Text Sources