

This is a preprint.
Ultrasound Characterization of Oral Soft Tissues in vivo Using the Burr Speckle Model
- PMID: 39398210
- PMCID: PMC11469411
Ultrasound Characterization of Oral Soft Tissues in vivo Using the Burr Speckle Model
Abstract
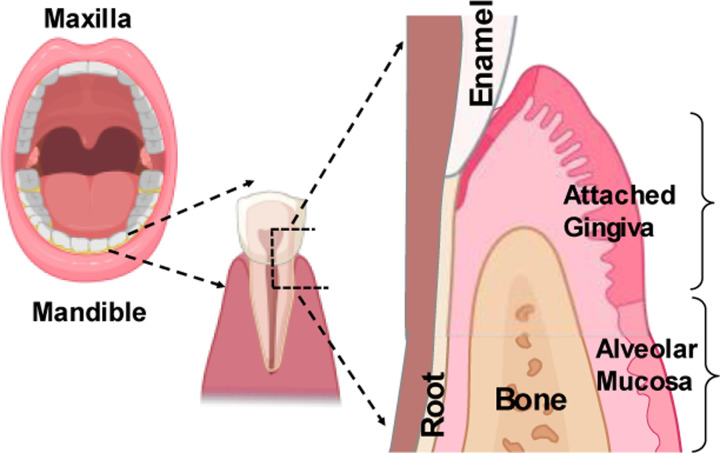
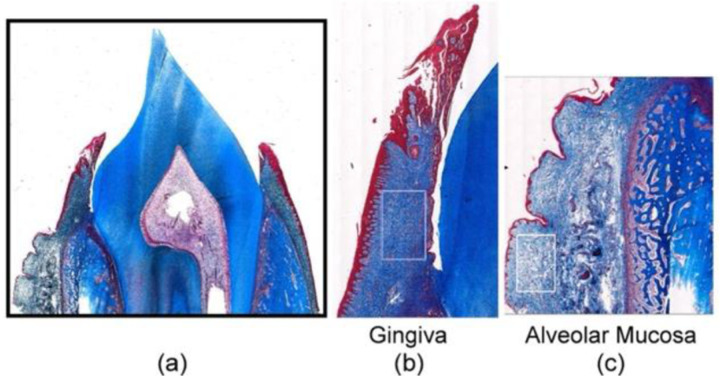
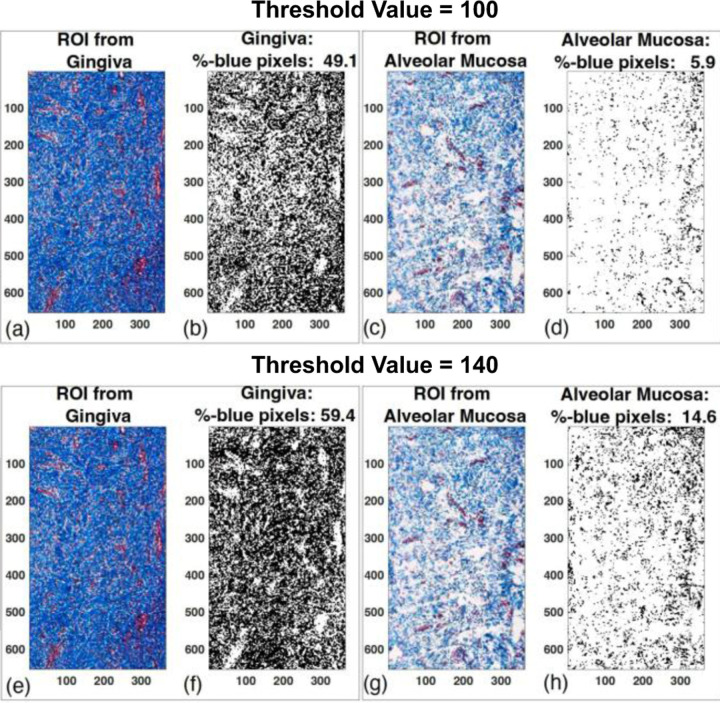
Periodontal (gum) diseases, reportedly affect 4 out of 10 adults 30 years of age or older in the USA. The standard of care for clinical assessments of these diseases is bleeding on probing, which is invasive, subjective and semi-qualitative. Thus, research on proposing alternative noninvasive modalities for clinical assessments of periodontal tissues is crucial. Quantitative Ultrasound (QUS) has shown promises in noninvasive assessments of various diseases in soft biological tissues; however, it has not been employed in periodontology. Here as the first step, we focused on QUS-based characterization of two very adjacent oral soft tissues of alveolar mucosa and attached gingiva in an in vivo animal study. We investigated first order ultrasonic speckle statistics using the two-parameter Burr model (power-law b and scale factor l). Our QUS analysis was compared with the Masson's Trichrome histology images of the two oral tissue types quantitatively using the RGB color thresholding. QUS study included 10 swine and US scanning was performed at the first and second molars of all four oral quadrants in each swine, resulting in 80 scans. US scan data was acquired at the transit/receive frequency of 24 MHz using a toothbrush-sized transducer. Parametric imaging of Burr parameters was created using a sliding kernel method with linear interpolations. The kernel size and overlap ratio was 10 wavelengths and 70%, respectively. No statistically significant difference was reported for estimated parameters when interpolation was performed (p-value>0.01). Results at both oral sites (molar 1 and molar 2) showed that the difference between the two tissue types using Burr parameters were statistically significant (p-value<0.0001). The average Burr b was reported to be higher in attached gingiva while the average Burr l was lower compared to mucosa. Visual comparison of Masson Trichrome histology images of these tissues showed denser color density in gingiva. The color thresholding of these images further confirmed that the percent of blue, which stains collagenous regions, was at least two times higher in gingiva than alveolar mucosa, based on threshold values. Comparing histology and QUS in characterizing the two tissue types, it was suggested that the elevated Burr b (related to potential scatterer densities) in gingiva could be aligned with findings from Masson's Trichrome histology. This study showed a promising potential of QUS for periodontal soft tissue characterization.
Keywords: Burr model; color thresholding; histology; periodontal soft tissues; quantitative ultrasound; speckle statistics.
Figures


Similar articles
-
Quantitative Ultrasound for Periodontal Soft Tissue Characterization.Ultrasound Med Biol. 2025 Feb;51(2):288-301. doi: 10.1016/j.ultrasmedbio.2024.10.003. Epub 2024 Nov 24. Ultrasound Med Biol. 2025. PMID: 39581822
-
Quantitative Ultrasound for Periodontal Soft Tissue Characterization.ArXiv [Preprint]. 2024 Sep 28:arXiv:2404.12896v2. ArXiv. 2024. Update in: Ultrasound Med Biol. 2025 Feb;51(2):288-301. doi: 10.1016/j.ultrasmedbio.2024.10.003. PMID: 38699163 Free PMC article. Updated. Preprint.
-
Speckle from branching vasculature: dependence on number density.J Med Imaging (Bellingham). 2020 Mar;7(2):027001. doi: 10.1117/1.JMI.7.2.027001. Epub 2020 Apr 11. J Med Imaging (Bellingham). 2020. PMID: 32313816 Free PMC article.
-
Quantitative ultrasound imaging of soft biological tissues: a primer for radiologists and medical physicists.Insights Imaging. 2021 Sep 9;12(1):127. doi: 10.1186/s13244-021-01071-w. Insights Imaging. 2021. PMID: 34499249 Free PMC article. Review.
-
A Review of Ultrasound Tissue Characterization with Mean Scatterer Spacing.Ultrason Imaging. 2017 Sep;39(5):263-282. doi: 10.1177/0161734617692018. Epub 2017 Mar 6. Ultrason Imaging. 2017. PMID: 28797220 Review.
References
-
- Eke P. I., Dye B. A., Wei L., Slade G. D., Thornton-Evans G. O., Borgnakke W. S., Taylor G. W., Page R. C., Beck J. D., and Genco R. J., “Update on prevalence of periodontitis in adults in the united states: Nhanes 2009 to 2012,” Journal of periodontology, vol. 86, no. 5, pp. 611–622, 2015. - PMC - PubMed
-
- Chan H.-L. A. and Kripfgans O. D., “Dental ultrasound in periodontol- ogy and implantology,” Cham: Springer, pp. 161–75, 2020.
-
- Chan H., Sinjab K., Li J., Chen Z., Wang H., and Kripfgans O. D., “Ultrasonography for noninvasive and real-time evaluation of peri-implant tissue dimensions,” Journal of clinical periodontology, vol. 45, no. 8, pp. 986–995, 2018. - PubMed
Publication types
Grants and funding
LinkOut - more resources
Full Text Sources