. 2024 Sep 27:12:1483345.
doi: 10.3389/fcell.2024.1483345. eCollection 2024.

Cytokinetic contractile ring structural progression in an early embryo: positioning of scaffolding proteins, recruitment of α-actinin, and effects of myosin II inhibition

Affiliations

Cytokinetic contractile ring structural progression in an early embryo: positioning of scaffolding proteins, recruitment of α-actinin, and effects of myosin II inhibition

John H Henson et al. Front Cell Dev Biol. .

Abstract

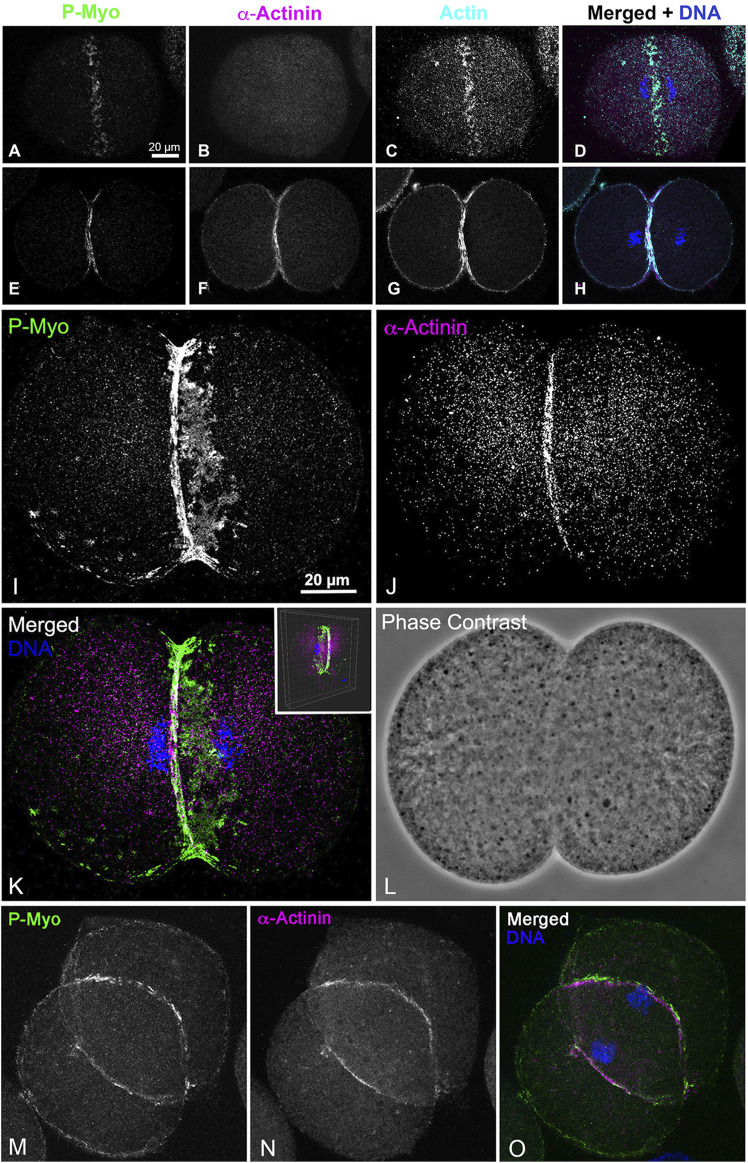
Our knowledge of the assembly and dynamics of the cytokinetic contractile ring (CR) in animal cells remains incomplete. We have previously used super-resolution light microscopy and platinum replica electron microscopy to elucidate the ultrastructural organization of the CR in first division sea urchin embryos. To date, our studies indicate that the CR initiates as an equatorial band of clusters containing myosin II, actin, septin and anillin, which then congress over time into patches which coalesce into a linear array characteristic of mature CRs. In the present study, we applied super-resolution interferometric photoactivated localization microscopy to confirm the existence of septin filament-like structures in the developing CR, demonstrate the close associations between septin2, anillin, and myosin II in the CR, as well as to show that septin2 appears consistently submembranous, whereas anillin is more widely distributed in the early CR. We also provide evidence that the major actin cross-linking protein α-actinin only associates with the linearized, late-stage CR and not with the early CR clusters, providing further support to the idea that α-actinin associates with actomyosin structures under tension and can serve as a counterbalance. In addition, we show that inhibition of actomyosin contraction does not stop the assembly of the early CR clusters but does arrest the progression of these structures to the aligned arrays required for functional cytokinesis. Taken together our results reinforce and extend our model for a cluster to patch to linear structural progression of the CR in sea urchin embryos and highlight the evolutionary relationships with cytokinesis in fission yeast.

Keywords: actin; anillin; contractile ring; cytokinesis; myosin II; sea urchin; septin; α-actinin.


Conflict of interest statement

The authors declare that the research was conducted in the absence of any commercial or financial relationships that could be construed as a potential conflict of interest. The author(s) declared that they were an editorial board member of Frontiers, at the time of submission. This had no impact on the peer review process and the final decision.

Figures

FIGURE 1
FIGURE 1
CR structure in isolated cortices and whole embryos evolves from a band of clusters to a dense, linearized array. Early cortices (A, D–F) and embryos (J) contain a nascent CR consisting of a band of focal clusters of myosin II (P-Myo), anillin, and septin2. This organization congresses into denser patches (B, K) and then linear arrays characteristic of the mature CR (C, G–I, L). Scale bars = 10 µm.
FIGURE 2
FIGURE 2
iPALM imaging demonstrates the concentration of F-actin in the CR of an isolated cortex. Maximum intensity projection of iPALM imaging of phalloidin stained F-actin in an isolated cleavage cortex (A) shows the CR as an accumulation of actin (cyan) staining running down the middle of the cortex and codistributing with activated myosin II (P-Myo, magenta) localized with near-TIRF imaging (B). Actin filaments in (C) are pseudo-colored in accordance with height above the substrate and the surface plot in (D) (derived from box in (C) shows actin in the mid stripe CR has higher intensity actin labeling and is slightly elevated above the surrounding cortex. Microvillar core bundles of F-actin are most obvious around the edges of the cortex. Note that the black oval holes in the cortex correspond to the positions of gold nanorod fiducial markers that are removed during image processing.
FIGURE 3
FIGURE 3
iPALM imaging of septin2 and myosin II in the CR of isolated cortices. (A) Maximum intensity projection of an early to mid-stage CR shows a broad band of septin2 (Sept2 - magenta) and myosin II (P-Myo - green) staining. Higher magnification images of the clusters outlined in boxes 1–3 in (A) (B–D) show 3 × 3 µm XY and associated 3 × 0.8 µm XZ images (orthogonal reslice plane = line in B-D) in which septin2 and myosin II are closely associated, with septin2 often in the center of clusters in XY, whereas in the Z images the septin2 is associated with the expected submembranous region nearest the coverslip [(B–D), bottom of images]. (E) In a mid-stage CR, patches of septin2 and myosin II staining are evident with higher magnification of those outlined in boxes 4–6 (F–H) show 7 × 7 µm XY and associated 3 × 0.5 µm XZ images [orthogonal reslice plane = line in (F–H)] with filament-like septin2 staining pattern in XY and a clear segregation between submembranous septin2 and deeper myosin II in Z. (I) Plot of sept2 filament width in patches shows no significant difference with an average of approximately 93 nm. (J) Shows output of FibrilTool analysis of sept2 stained patch (lower yellow ROI box) vs nonpatch (upper yellow ROI box) in which the red line within the ROI box produced by this tool has a length proportional with the anisotropy index and appears at an angle parallel to the axis of orientation of the filamentous elements. Note the red line is significantly longer in the patch vs. the non-patch ROI. (K) Plot of measured anisotropy index vs patch and non-patch ROIs shows a significant difference, with anisotropy higher in patch regions.
FIGURE 4
FIGURE 4
iPALM imaging of anillin and myosin II in the CR of an isolated cortex. (A) Maximum intensity projection of an early to mid-stage CR shows a broad band of anillin (cyan) and myosin II (P-Myo - red) staining. Higher magnification images of the clusters outlined in boxes 1–3 (B–D) show a 10 × 3 µm XY (B) or 5 × 5 µm XY image (C, D) plus the associated XZ (Z = 1 µm) axial images [orthogonal reslice plane = line in (B–F)]. In these clusters the anillin appears to often reside in the center of the XY images, while in the Z axial images the anillin tends to extend deeper into the cortex and away from the membrane [(B–D), bottom of Z axial images]. Boxes 4 and 5 show patches of closely associated anillin and myosin II staining in XY (E, F), whereas in the Z images the anillin appears aligned along the presumptive submembranous region.
FIGURE 5
FIGURE 5
In isolated cortices ⍺-actinin localizes to late - but not early - CRs where it codistributes with linear actomyosin arrays. In cortices stained for activated myosin II (P-Myo) and alpha-actinin (A–F), early stage CRs (arrows in (A,D)) containing myosin II clusters do not contain α-actinin, but late stage CRs (arrowheads in (A,D)) do concentrate α-actinin, along with actin and myosin II (G–J). In select late stage cortices in which the CR is stretched during isolation, the characteristic discontinuous punctate ⍺-actinin staining of the CR linear actomyosin structure is particularly evident (K–P) reminiscent of ⍺-actinin staining of stress fibers in PK1 cells and coelomocytes (Supplementary Figure S1). Bar = 10 μm.
FIGURE 6
FIGURE 6
In whole embryos ⍺-actinin also localizes exclusively to late stage, linearized CRs. Early stage CRs in embryos contain activated myosin II (P-Myo) and F-actin clusters but no ⍺-actinin (A–D), whereas later stage CRs stain for all three of these CR constituent proteins (E–H). Late and early CR organizations can exist in the same embryo. A confocal through focus projection (I–L) shows a cluster-based CR on one side of an embryo with a linearized CR on the other. Note ⍺-actinin stains only the linearized structure and not the clusters, whereas activated myosin II localizes to both (I–K). Inset in K shows a 3D reconstruction of the merged image. A through focus projection of an embryo with a late stage and fully linearized CR demonstrates staining for activated myosin II and ⍺-actinin throughout (M–O).
FIGURE 7
FIGURE 7
PAB inhibits cytokinesis but not karyokinesis in embryos. A graph of percent completed cytokinesis (A) shows the inhibitory impact of 100 µM PAB treatment (red line) relative to DMSO treated controls (blue line). The brightfield image insets in panel A show live control (top) and +PAB (bottom) embryos 140 min post-fertilization in which the controls have divided completely and the +PAB are exhibiting elongation, flattening, slight constrictions, and/or the presence of two nuclei. In DIC plus fluorescence images of live + PAB embryos 160 min after fertilization (B) staining with Hoechst-33342 (blue) shows that these embryos are binucleate, confirming that karyokinesis takes place in the absence of cytokinesis.
FIGURE 8
FIGURE 8
Cortices isolated from PAB treated embryos contain a band of early CR-like myosin II clusters. Control cortices (A–E) show contracted CRs containing activated phospho-myosin II RLC [P-MyoII, (A)] along with myosin II heavy chain [MyoII HC, (B)], and F-actin (C). In contrast similar stage +100 µM PAB cortices (F–O) display broad bands of early CR-like myosin II (F, K) clusters which also contain septin2 (G), anillin (L), and F-actin (H, M). Linearized late stage CR structures are not present in +PAB cortices. Bar = 10 µm.
FIGURE 9
FIGURE 9
PAB treated embryos contain early CR-like bands of myosin II clusters along with control-like arrays of microtubules. Confocal images of the mid and cortical Z slices of control embryos (A–F, M–R) contain constricted CRs with dense assemblages of activated myosin II (P-Myo, A, D, M, P) and F-actin (B, E), along with associated microtubules (N, Q). +100 µM PAB embryos (G–L, S–X) contain an early CR-like band of myosin II clusters (G, J, S, V) with associated actin (H, K) and microtubules (T, W), however linear arrays of CR constituents are not present in these PAB-treated embryos. Furthermore, microtubule organization does not appear significantly disrupted by PAB treatment. Control embryos 130 min post-fertilization and +PAB embryos 140 min post-fertilization.

References

    1. Allingham J. S., Smith R., Rayment I. (2005). The structural basis of blebbistatin inhibition and specificity for myosin II. Nat. Struct. Mol. Biol. 12, 378–379. 10.1038/nsmb908 - DOI - PubMed
    1. Argiros H., Henson L., Holguin C., Foe V., Shuster C. B. (2012). Centralspindlin and chromosomal passenger complex behavior during normal and Rappaport furrow specification in echinoderm embryos. Cytoskeleton 69, 840–853. 10.1002/cm.21061 - DOI - PMC - PubMed
    1. Beach J. R., Shao L., Remmert K., Li D., Betzig E., Hammer J. A. (2014). Nonmuscle myosin II isoforms coassemble in living cells. Curr. Biol. 24, 1160–1166. 10.1016/j.cub.2014.03.071 - DOI - PMC - PubMed
    1. Bement W. M., Benink H. A., von Dassow G. (2005). A microtubule-dependent zone of active RhoA during cleavage plane specification. J. Cell Biol. 170, 91–101. 10.1083/jcb.200501131 - DOI - PMC - PubMed
    1. Bertin A., McMurray M. A., Thai L., Garcia G., Votin V., Grob P., et al. (2010). Phosphatidylinositol-4,5-bisphosphate promotes budding yeast septin filament assembly and organization. J. Mol. Biol. 404, 711–731. 10.1016/j.jmb.2010.10.002 - DOI - PMC - PubMed

LinkOut - more resources