. 2024 Sep 26:40:101831.
doi: 10.1016/j.bbrep.2024.101831. eCollection 2024 Dec.

The dose-effect response of combined red and infrared photobiomodulation on insulin resistance in skeletal muscle cells

Affiliations

The dose-effect response of combined red and infrared photobiomodulation on insulin resistance in skeletal muscle cells

Gabriela Silva et al. Biochem Biophys Rep. .

Abstract

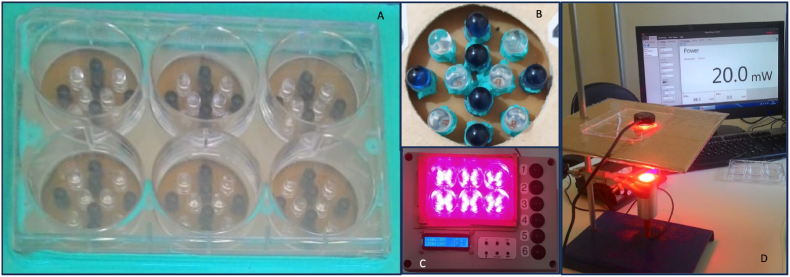
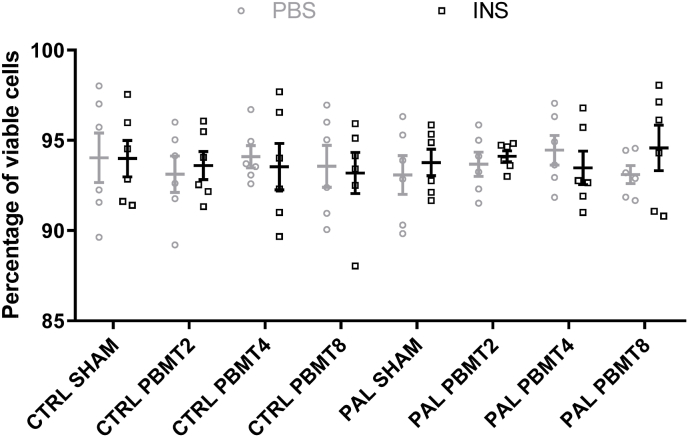
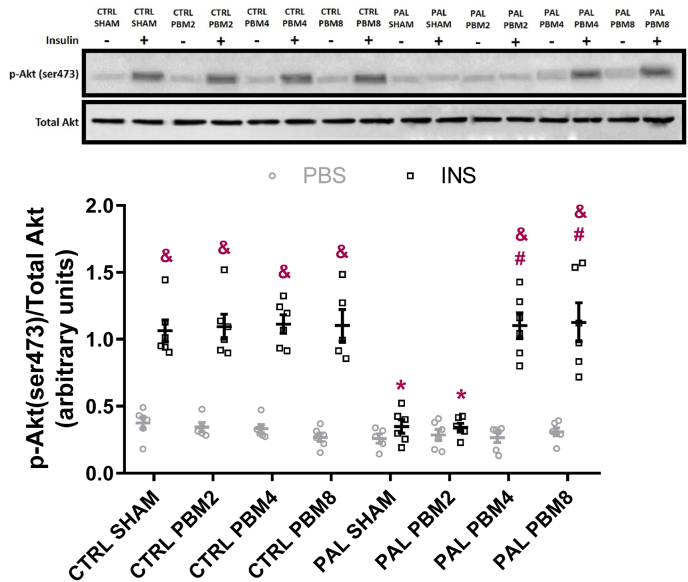
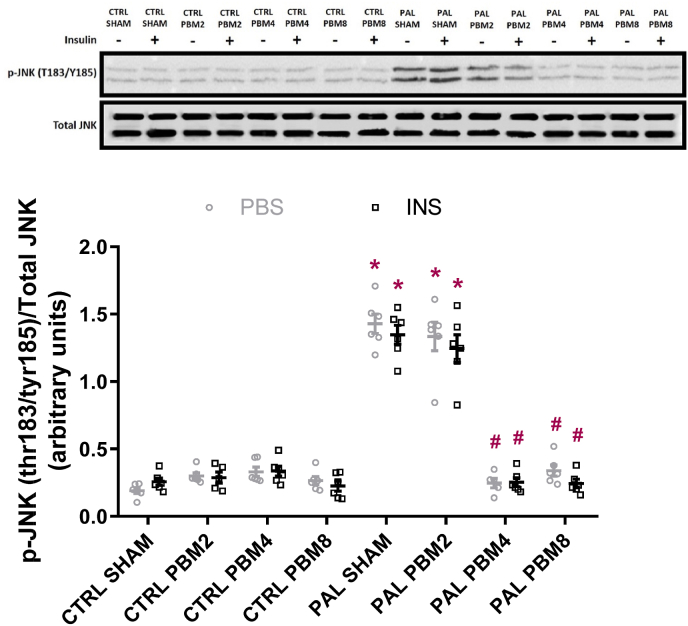
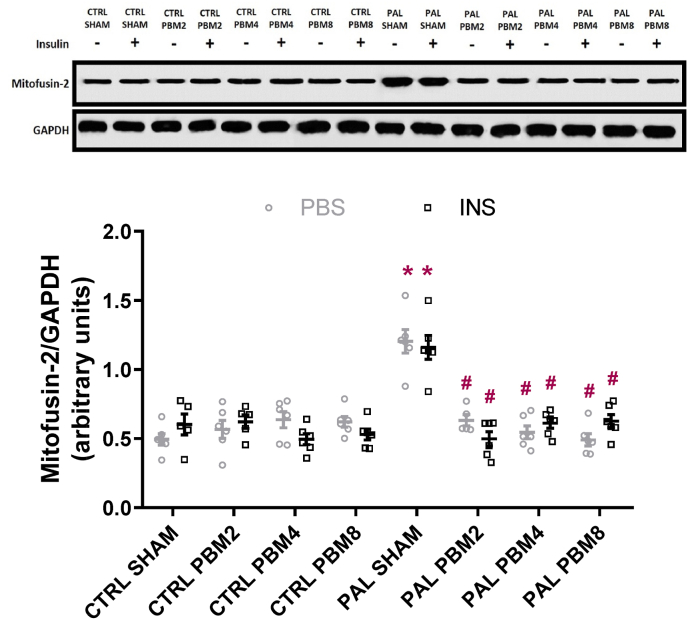
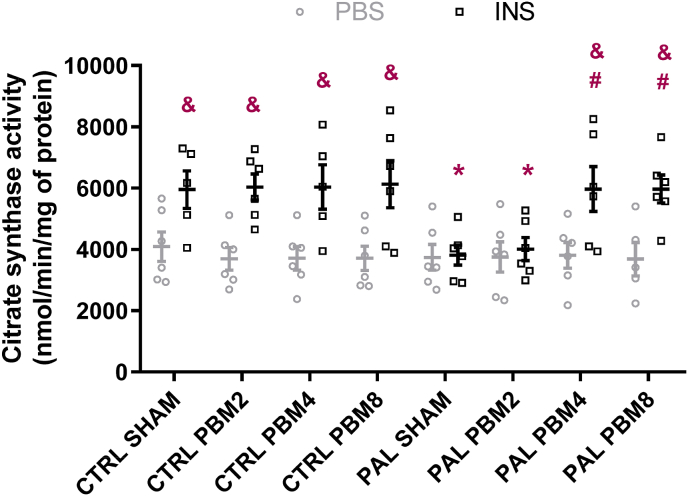
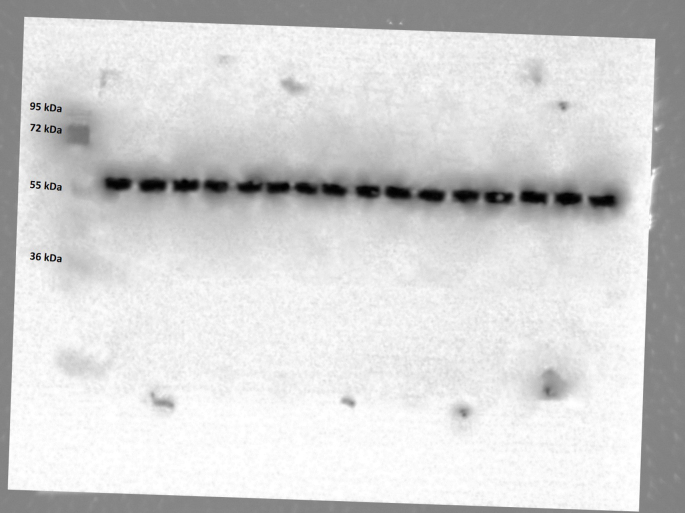
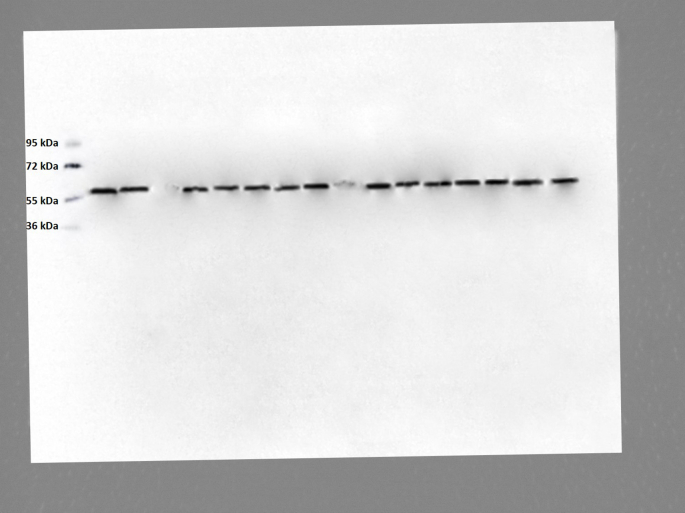
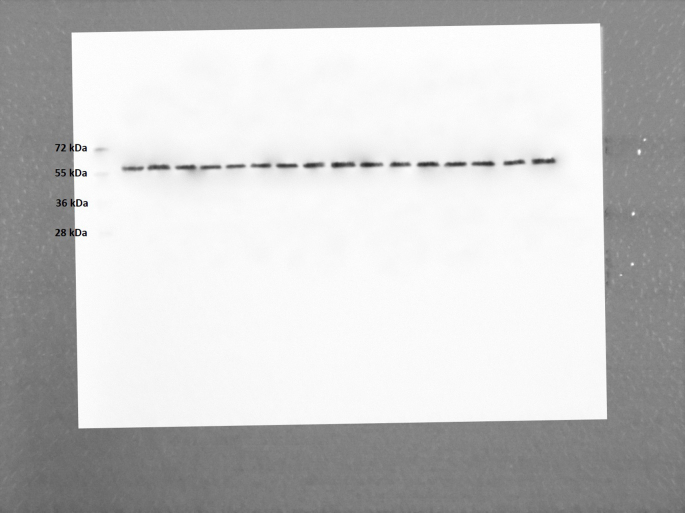
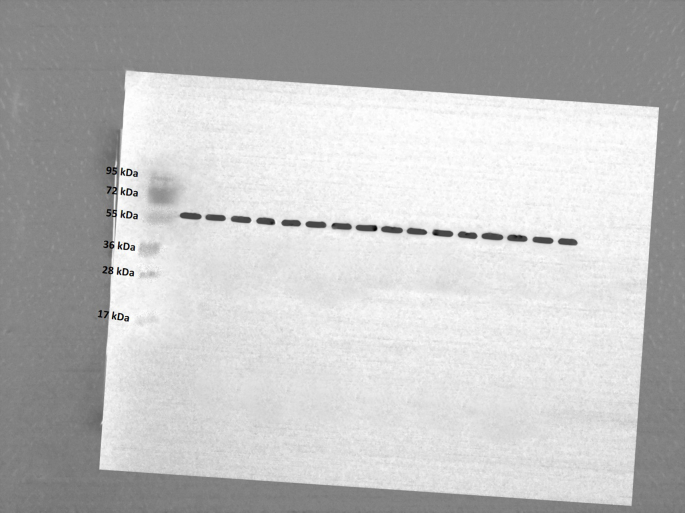
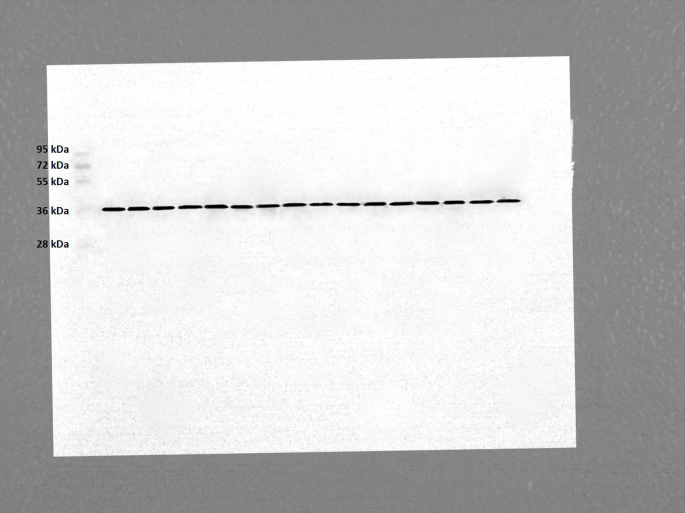
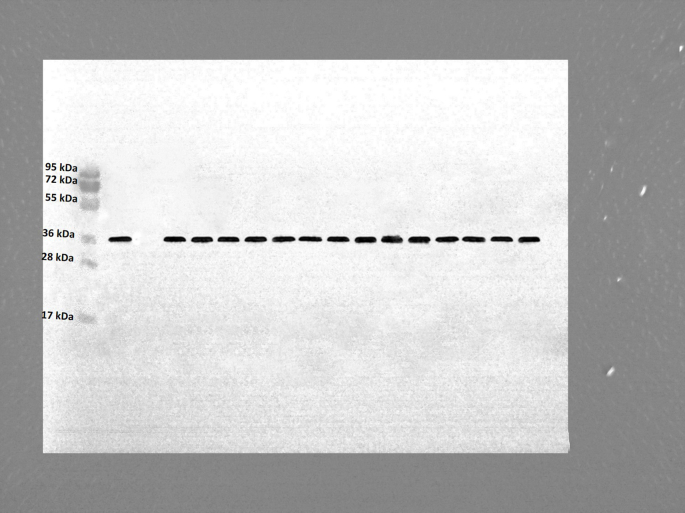
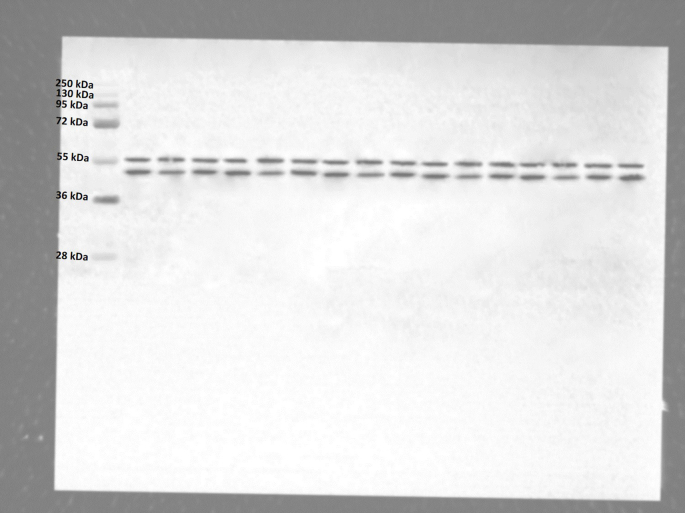
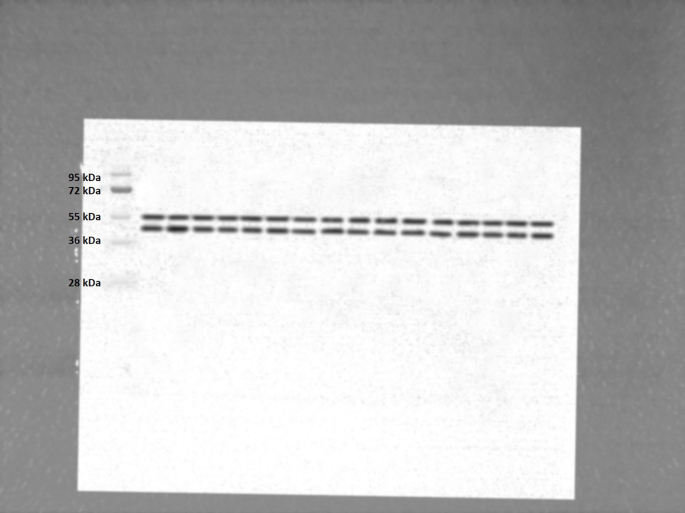
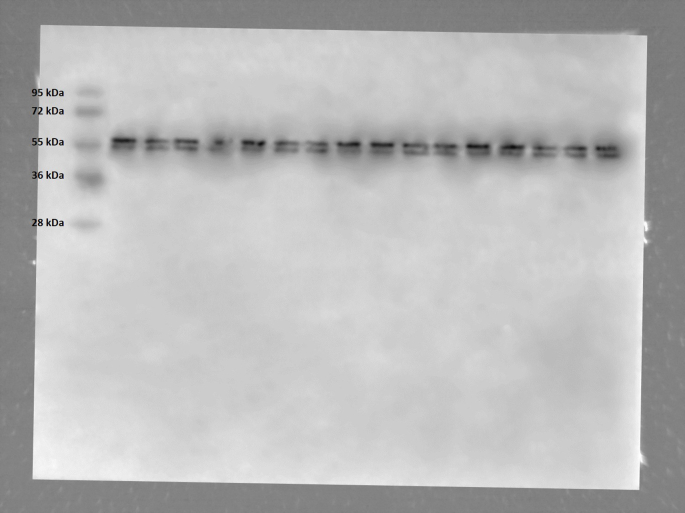
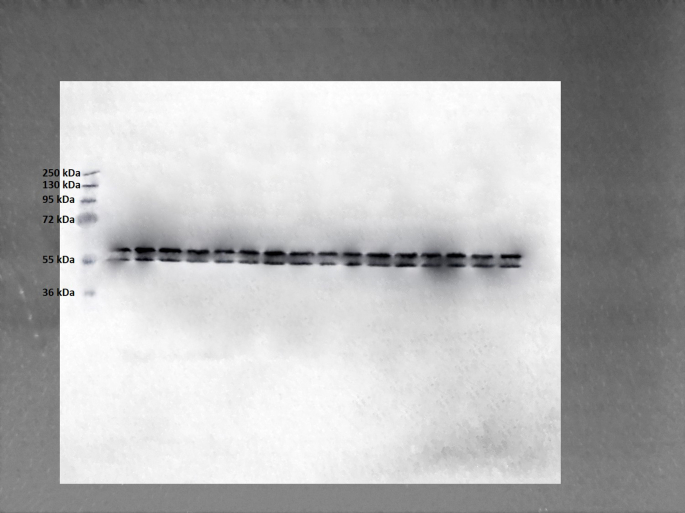
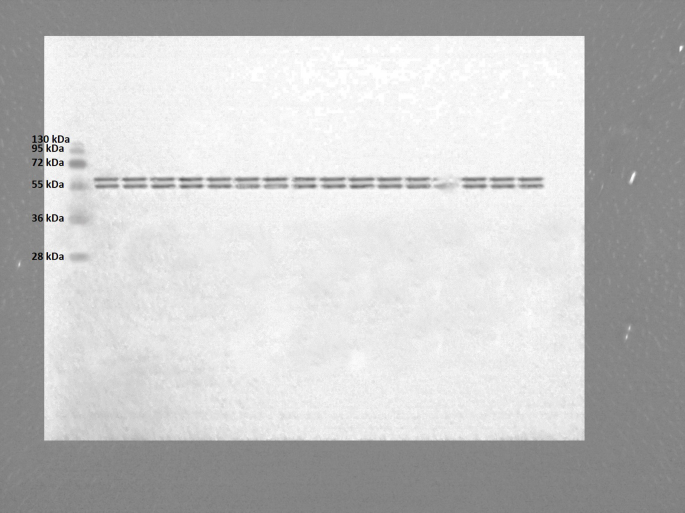
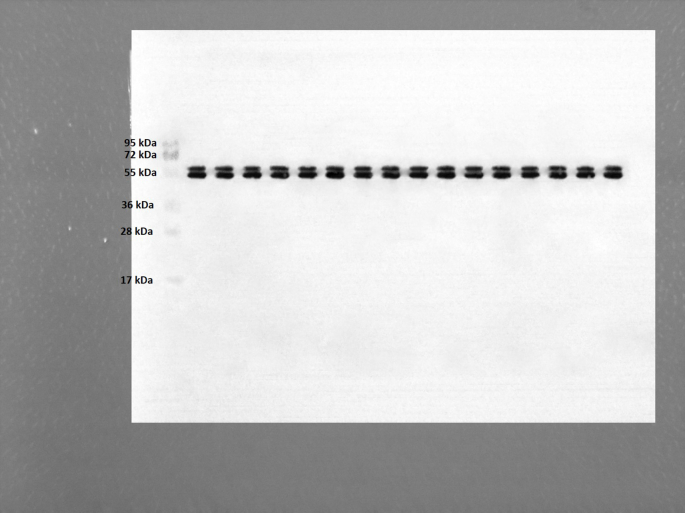
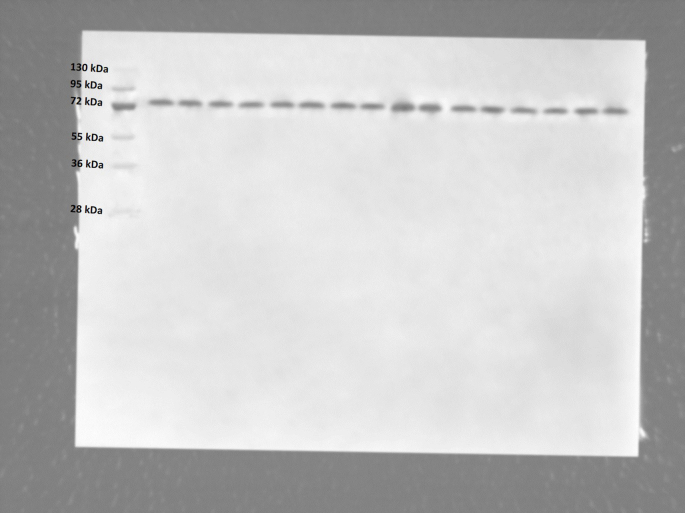
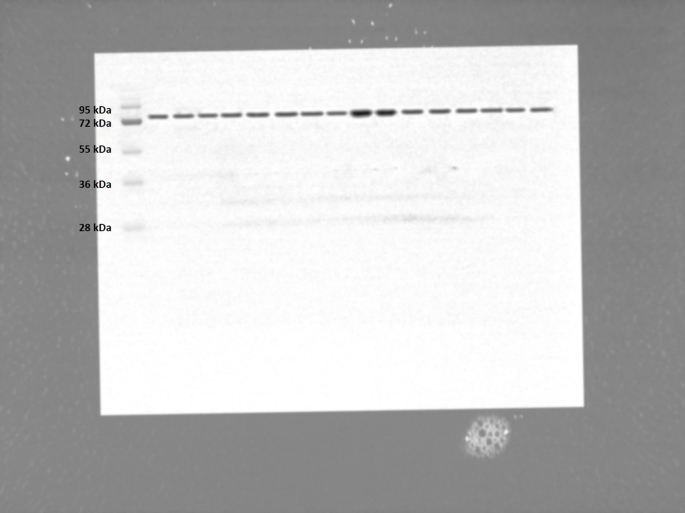
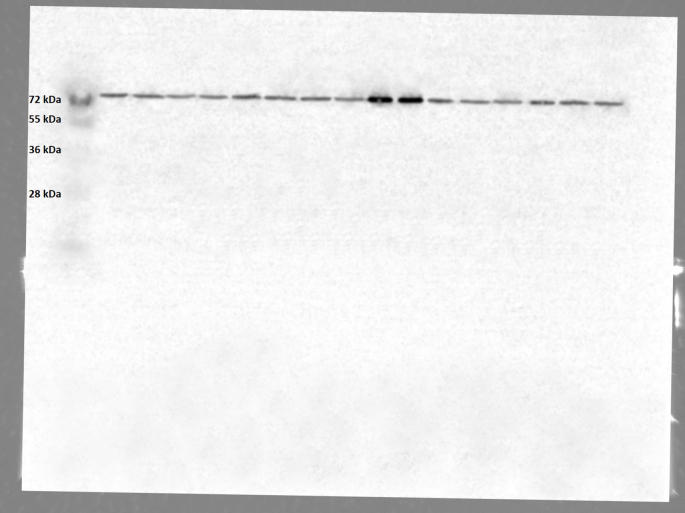
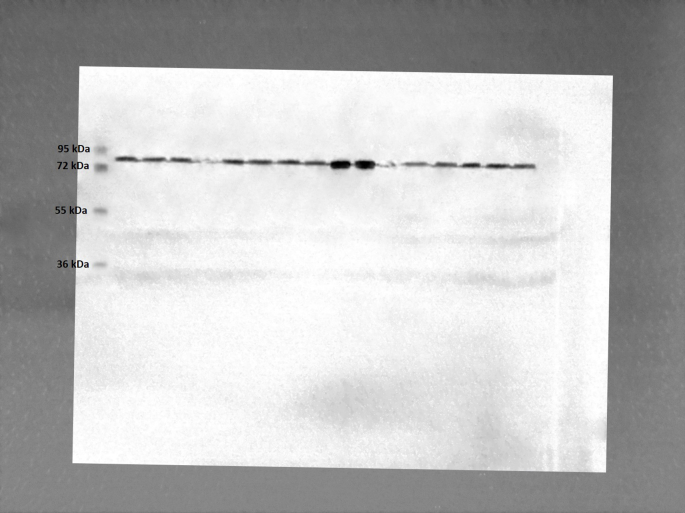
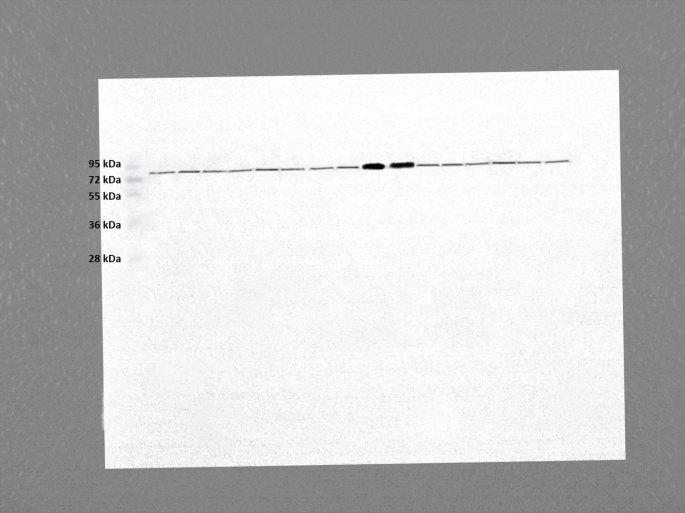
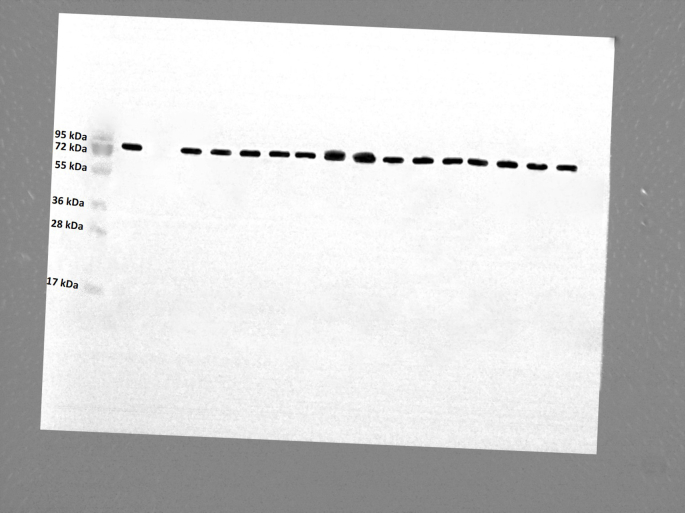
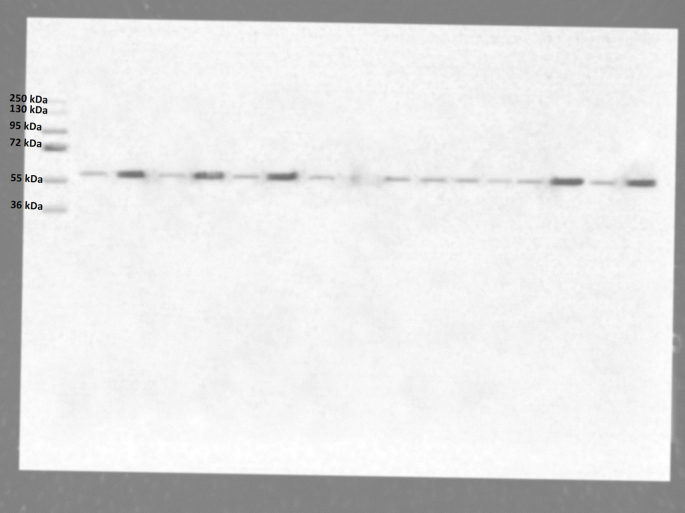
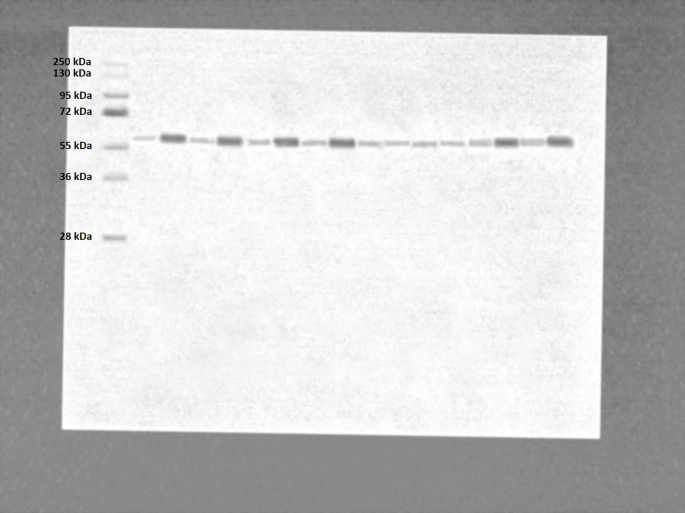
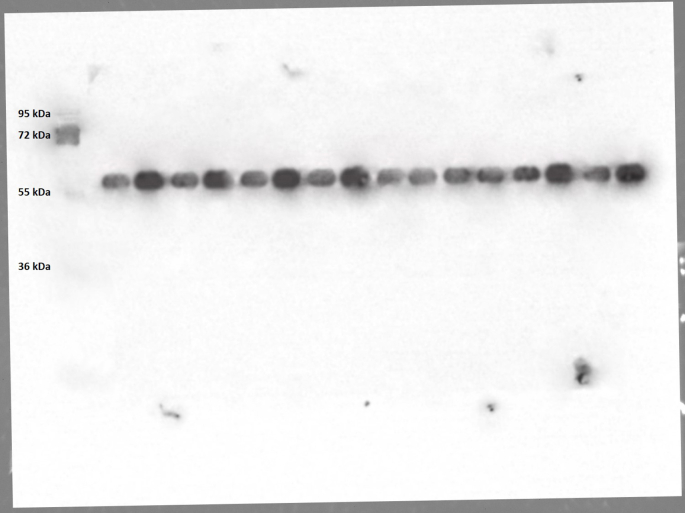
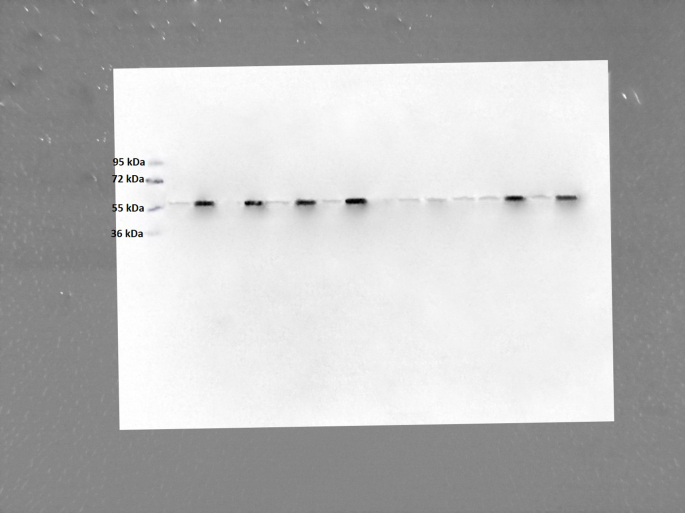
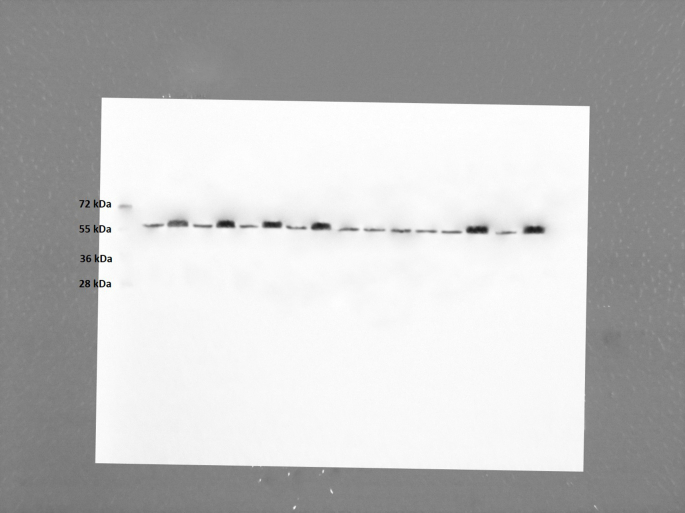
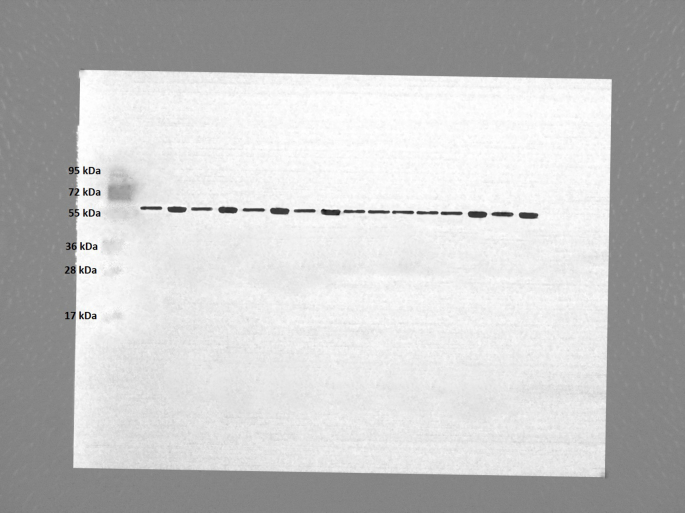
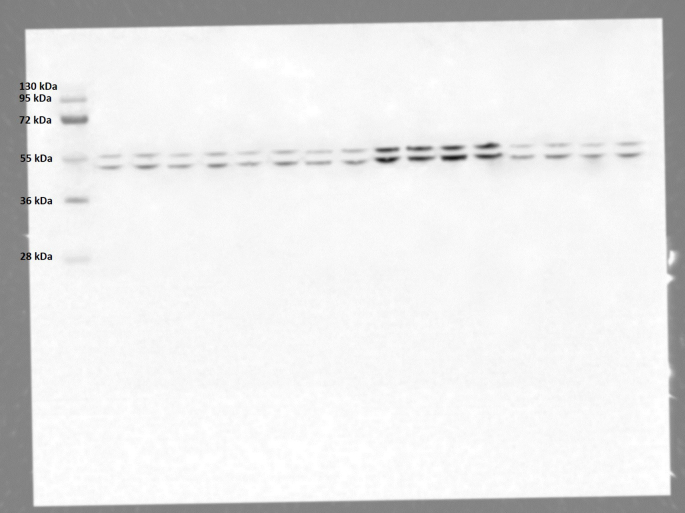
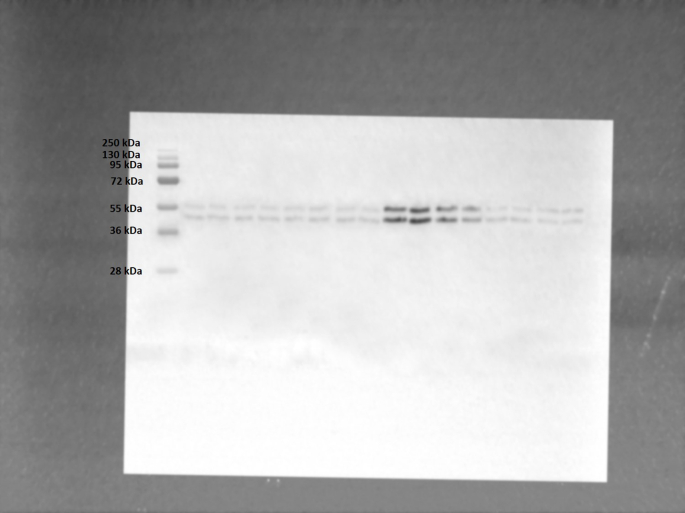
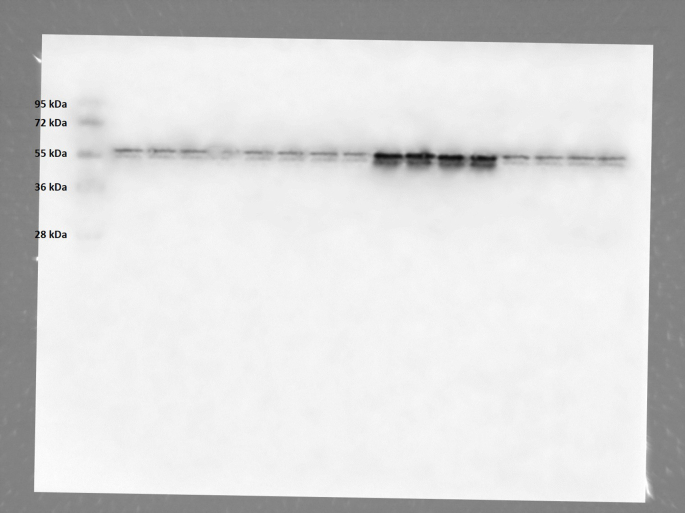
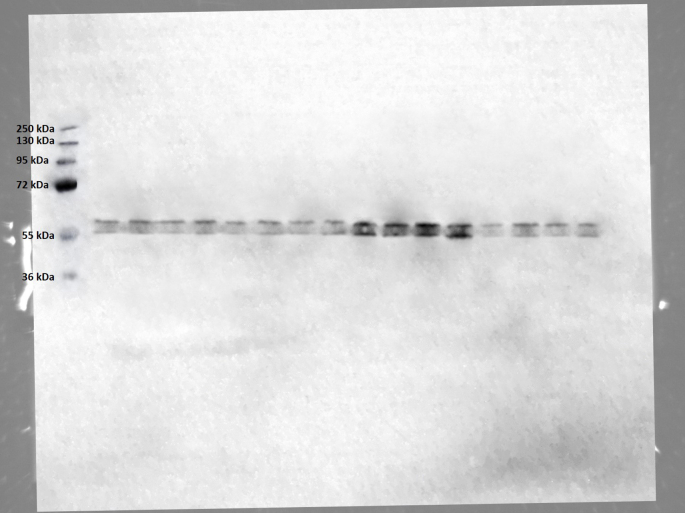
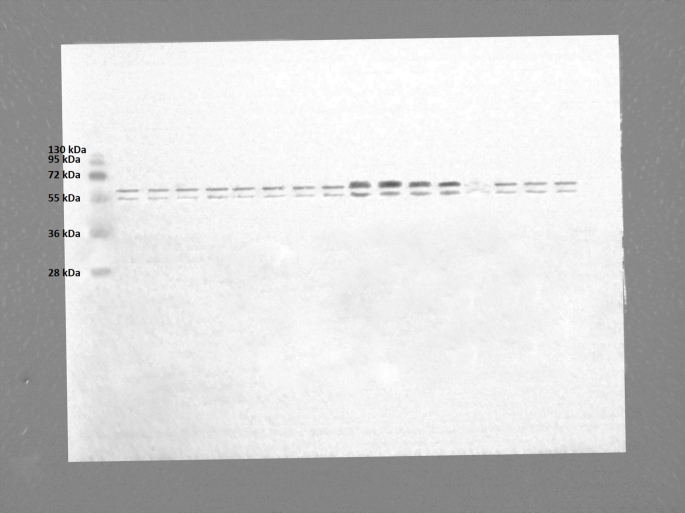
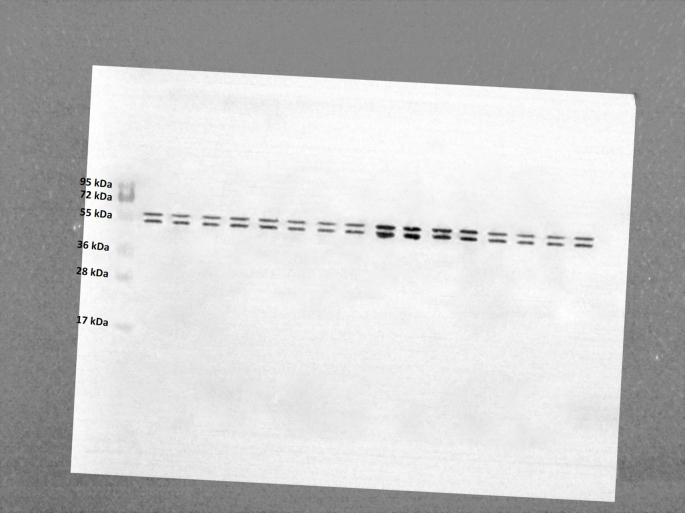
Obesity is a major public health problem and is a major contributor to the development of insulin resistance. In previous studies we observed that single-wavelength red or infrared photobiomodulation (PBM) improved insulin signaling in adipocytes and skeletal muscle of mice fed a high-fat diet, but information about the combination of different wavelengths, as well as the effect of different light doses (J/cm2) is lacking. Therefore, the aim of this study was to investigate the effects of different doses of dual-wavelength PBM on insulin signaling in muscle cell, and explore potential mechanisms involved. Mouse myoblasts (C2C12) were differentiated into myotubes and cultured in palmitic acid, sodium oleate and l-carnitine (PAL) to induce insulin resistance high or in glucose medium (CTRL). Then, they received SHAM treatment (lights off, 0 J/cm2) or PBM (660 + 850 nm; 2, 4 or 8 J/cm2). PAL induced insulin resistance (assessed by Akt phosphorylation at ser473), attenuated maximal citrate synthase activity, and increased the phosphorylation of c-Jun NH(2) terminal kinase (JNK) (T183/Y185). PBM at doses of 4 or 8 J/cm2 reversed these PAL-induced responses. Furthermore, at doses of 2, 4 or 8 J/cm2, PBM reversed the increase in mitofusin-2 content induced by PAL. In conclusion, the combination of dual-wavelength red and infrared PBM at doses of 4 and 8 J/cm2 improved intracellular insulin signaling in musculoskeletal cells, and this effect appears to involve the modulation of mitochondrial function and the attenuation of the activation of stress kinases.

Keywords: C2C12 cells; Inflammation; Light-emitting diode; Lipotoxicity; Mitochondrial dysfunction; Muscle tissue; Obesity; Photobiomodulation therapy; Type 2 diabetes.


Conflict of interest statement

The authors declare that they have no known competing financial interests or personal relationships that could have appeared to influence the work reported in this paper.

Figures

Fig. 1
Fig. 1
PBM device in C2C12 myotubes. A: Each individual well was illuminated by a cluster of 12 LED diodes (6 red – 660 nm, and 6 infrared – 850 nm). B: Detailed arrangement of the diodes. C: Device in operation. D: example of optical power being assessed. (For interpretation of the references to colour in this figure legend, the reader is referred to the Web version of this article.)
Fig. 2
Fig. 2
Cellular viability of C2C12 myotubes. Effect of CTRL or PAL media and SHAM or PBM2 or PBM4 or PBM8 treatment and PBS or INS stimulation on cell viability. Groups: CTRL-SHAM-PBS (n = 6); CTRL-SHAM-INS (n = 6); CTRL-PBM2-PBS (n = 6); CTRL-PBM2-INS (n = 6); CTRL-PBM4-PBS (n = 6); CTRL-PBM4-INS (n = 6); CTRL-PBM8-PBS (n = 6); CTRL-PBM8-INS (n = 6); PAL-SHAM-PBS (n = 6); PAL-SHAM-INS (n = 6); PAL-PBM2-PBS (n = 6); PAL-PBM2-INS (n = 6); PAL-PBM4-PBS (n = 6); PAL-PBM4-INS (n = 6); PAL-PBM8-PBS (n = 6); PAL-PBM8-INS (n = 6).
Fig. 3
Fig. 3
Phosphorylation of Akt (ser473) in C2C12 myotubes. Effect of CTRL or PAL media and SHAM or PBM2 or PBM4 or PBM8 treatment and PBS (−) or INS (+) stimulation on Akt (ser473) phosphorylation. ∗p < 0.05 vs CTRL; #p < 0.05 vs PAL-SHAM e PAL-PBM2; & p < 0.05 vs PBS. Groups: CTRL-SHAM-PBS (n = 6); CTRL-SHAM-INS (n = 6); CTRL-PBM2-PBS (n = 5); CTRL-PBM2-INS (n = 6); CTRL-PBM4-PBS (n = 6); CTRL-PBM4-INS (n = 6); CTRL-PBM8-PBS (n = 6); CTRL-PBM8-INS (n = 5); PAL-SHAM-PBS (n = 5); PAL-SHAM-INS (n = 6); PAL-PBM2-PBS (n = 6); PAL-PBM2-INS (n = 6); PAL-PBM4-PBS (n = 6); PAL-PBM4-INS (n = 6); PAL-PBM8-PBS (n = 6); PAL-PBM8-INS (n = 6).
Fig. 4
Fig. 4
Phosphorylation of JNK (thr183/tyr185) in C2C12 myotubes. Effect of CTRL or PAL media and SHAM or PBM2 or PBM4 or PBM8 treatment and PBS (−) or INS (+) stimulation on JNK (thr183/tyr185) phosphorylation. ∗p < 0.05 vs CTRL; #p < 0.05 vs PAL-SHAM e PAL-PBM2. Grupos: CTRL-SHAM-PBS (n = 6); CTRL-SHAM-INS (n = 6); CTRL-PBM2-PBS (n = 6); CTRL-PBM2-INS (n = 5); CTRL-PBM4-PBS (n = 6); CTRL-PBM4-INS (n = 6); CTRL-PBM8-PBS (n = 6); CTRL-PBM8-INS (n = 6); PAL-SHAM-PBS (n = 6); PAL-SHAM-INS (n = 6); PAL-PBM2-PBS (n = 6); PAL-PBM2-INS (n = 6); PAL-PBM4-PBS (n = 5); PAL-PBM4-INS (n = 6); PAL-PBM8-PBS (n = 6); PAL-PBM8-INS (n = 6).
Fig. 5
Fig. 5
Mitofusin-2 content in C2C12 myotubes. Effect of CTRL or PAL medium and SHAM or PBM2 or PBM4 or PBM8 treatment and PBS (−) or INS (+) stimulation on mitofusin-2 content. ∗p < 0.05 vs CTRL; #p < 0.05 vs PAL-SHAM. Groups: CTRL-SHAM-PBS (n = 6); CTRL-SHAM-INS (n = 5); CTRL-PBM2-PBS (n = 6); CTRL-PBM2-INS (n = 5); CTRL-PBM4-PBS (n = 6); CTRL-PBM4-INS (n = 6); CTRL-PBM8-PBS (n = 6); CTRL-PBM8-INS (n = 6); PAL-SHAM-PBS (n = 6); PAL-SHAM-INS (n = 6); PAL-PBM2-PBS (n = 5); PAL-PBM2-INS (n = 6); PAL-PBM4-PBS (n = 6); PAL-PBM4-INS (n = 6); PAL-PBM8-PBS (n = 6); PAL-PBM8-INS (n = 6).
Fig. 6
Fig. 6
Maximum citrate synthase activity in C2C12 myotubes. Effect of CTRL or PAL medium and SHAM or PBM2 or PBM4 or PBM8 treatment and PBS (−) or INS (+) stimulation on maximal citrate synthase activity. ∗p < 0.05 vs CTRL; #p < 0.05 vs PAL-SHAM e PAL-PBM2; & p < 0.05 vs PBS. Groups: CTRL-SHAM-PBS (n = 6); CTRL-SHAM-INS (n = 5); CTRL-PBM2-PBS (n = 6); CTRL-PBM2-INS (n = 6); CTRL-PBM4-PBS (n = 6); CTRL-PBM4-INS (n = 5); CTRL-PBM8-PBS (n = 6); CTRL-PBM8-INS (n = 6); PAL-SHAM-PBS (n = 6); PAL-SHAM-INS (n = 6); PAL-PBM2-PBS (n = 6); PAL-PBM2-INS (n = 6); PAL-PBM4-PBS (n = 6); PAL-PBM4-INS (n = 6); PAL-PBM8-PBS (n = 5); PAL-PBM8-INS (n = 6).
figs1
figs1
figs2
figs2
figs3
figs3
figs4
figs4
figs5
figs5
figs6
figs6
figs7
figs7
figs8
figs8
figs9
figs9
figs10
figs10
figs11
figs11
figs12
figs12
figs13
figs13
figs14
figs14
figs15
figs15
figs16
figs16
figs17
figs17
figs18
figs18
figs19
figs19
figs20
figs20
figs21
figs21
figs22
figs22
figs23
figs23
figs24
figs24
figs25
figs25
figs26
figs26
figs27
figs27
figs28
figs28
figs29
figs29
figs30
figs30
figs31
figs31
figs32
figs32
figs33
figs33
figs34
figs34
figs35
figs35
figs36
figs36

Similar articles

Cited by

References

    1. World Health Organization (WHO) Obesity and overweight. 2024. https://www.Who.Int/News-Room/Fact-Sheets/Detail/Obesity-and-Overweight
    1. WHO - WORLD HEALTH ORGANIZATION Obesity. 2021 https://www.Who.Int/News-Room/Facts-in-Pictures/Detail/6-Facts-on-Obesit...
    1. J.H.U.& M. (JHU) JHU COVID-19 dashboard by the center for systems science and engineering (CSSE) at johns hopkins university (JHU) 2023. https://Coronavirus.Jhu.Edu/Map.Html
    1. Chavez J.A., Summers S.A. Characterizing the effects of saturated fatty acids on insulin signaling and ceramide and diacylglycerol accumulation in 3T3-L1 adipocytes and C2C12 myotubes. Arch. Biochem. Biophys. 2003;419:101–109. doi: 10.1016/j.abb.2003.08.020. - DOI - PubMed
    1. Davis J., Gabler N., Walker-Daniels J., Spurlock M. The c-jun N-terminal kinase mediates the induction of oxidative stress and insulin resistance by palmitate and toll-like receptor 2 and 4 ligands in 3T3-L1 adipocytes. Horm. Metab. Res. 2009;41:523–530. doi: 10.1055/s-0029-1202852. - DOI - PubMed

LinkOut - more resources