. 2024 Sep 15;16(9):5020-5037.
doi: 10.62347/OCFT1003. eCollection 2024.

Combination of melatonin-delivered endothelial progenitor cells with S-nitroso-N-acetyl-DL-penicillamine for improving critical limb ischemia in the rat

Affiliations

Combination of melatonin-delivered endothelial progenitor cells with S-nitroso-N-acetyl-DL-penicillamine for improving critical limb ischemia in the rat

Jui-Ning Yeh et al. Am J Transl Res. .

Abstract

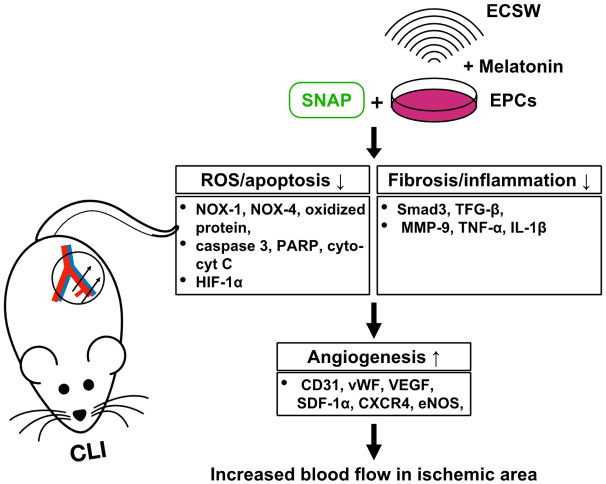
Background: This study tested whether combined shock wave (SW)-facilitated melatonin (Mel) delivered into endothelial progenitor cells (EPCs) (EPCSW-Mel) plus S-nitroso-N-acetyl-DL-penicillamine (SNAP) was superior to merely one modality alone for improving critical limb ischemia (CLI) in rats.

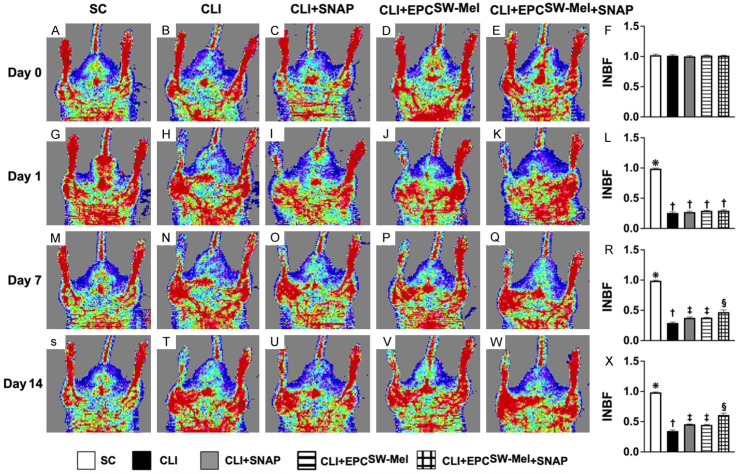
Methods: SD rats (n = 50) were equally categorized into group 1 (sham-control), group 2 (CLI), group 3 (CLI + SNAP), group 4 (CLI + EPCSW-Mel), and group 5 (CLI + EPCSW-Mel + SNAP), and ischemia-involved quadriceps were harvested by day 14.

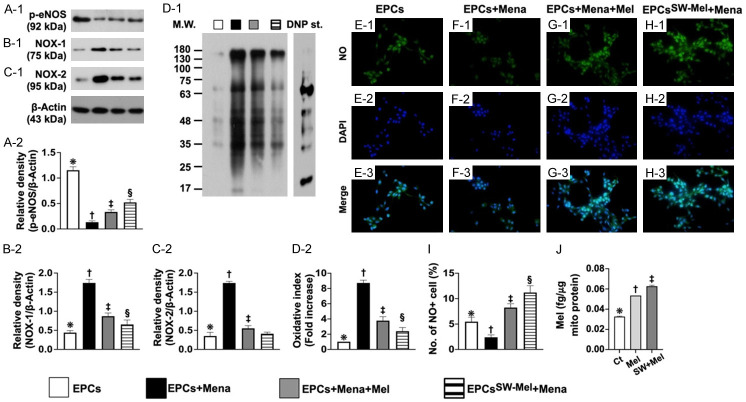
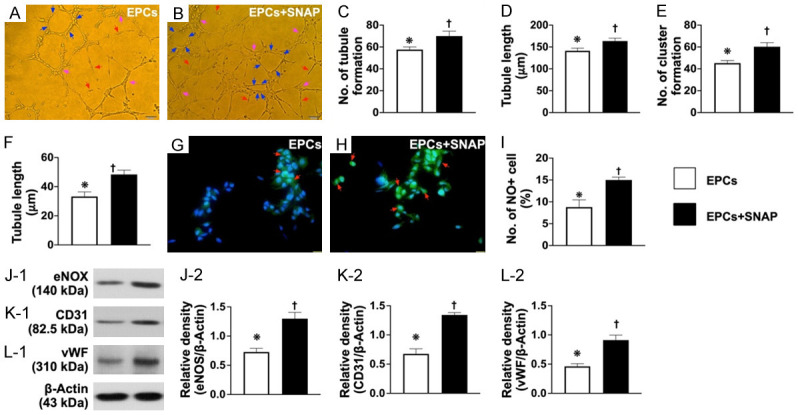
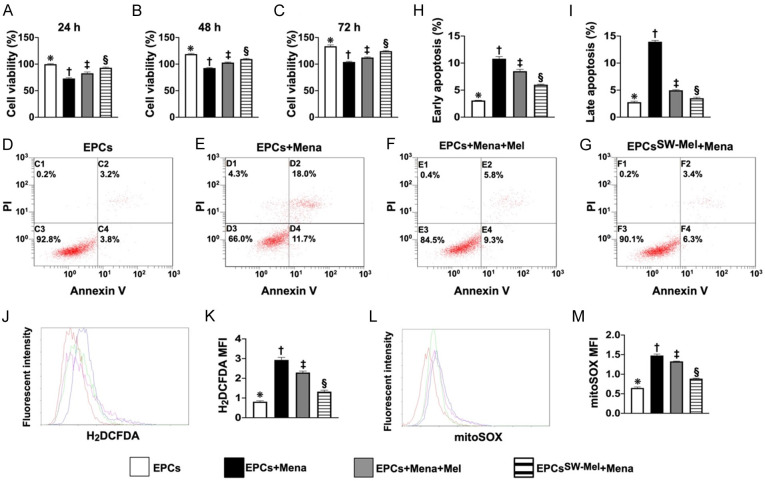
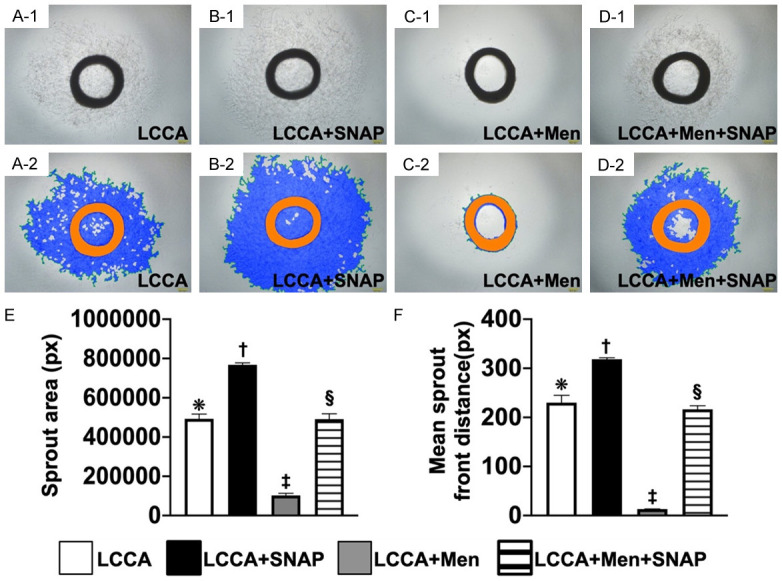
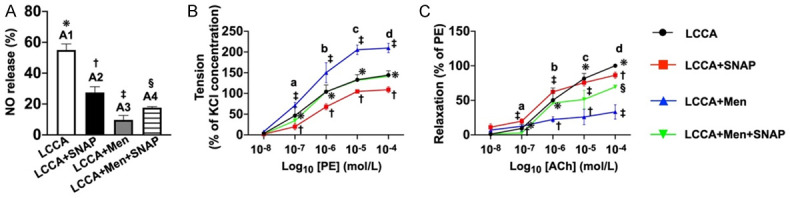
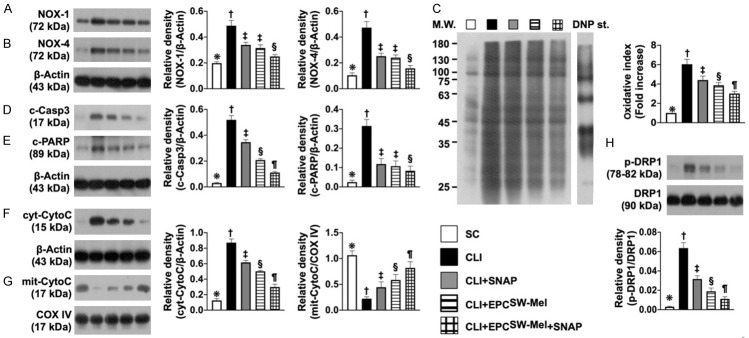
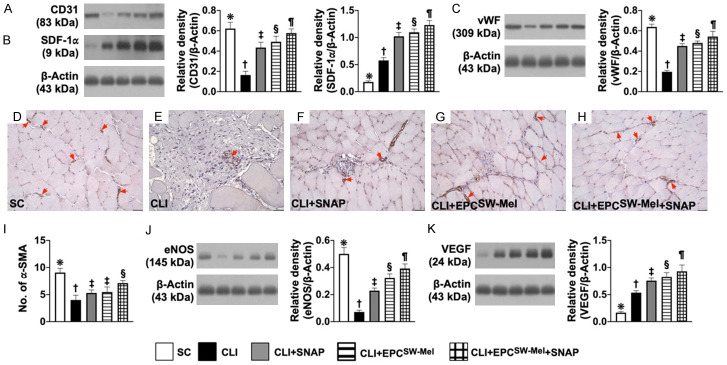
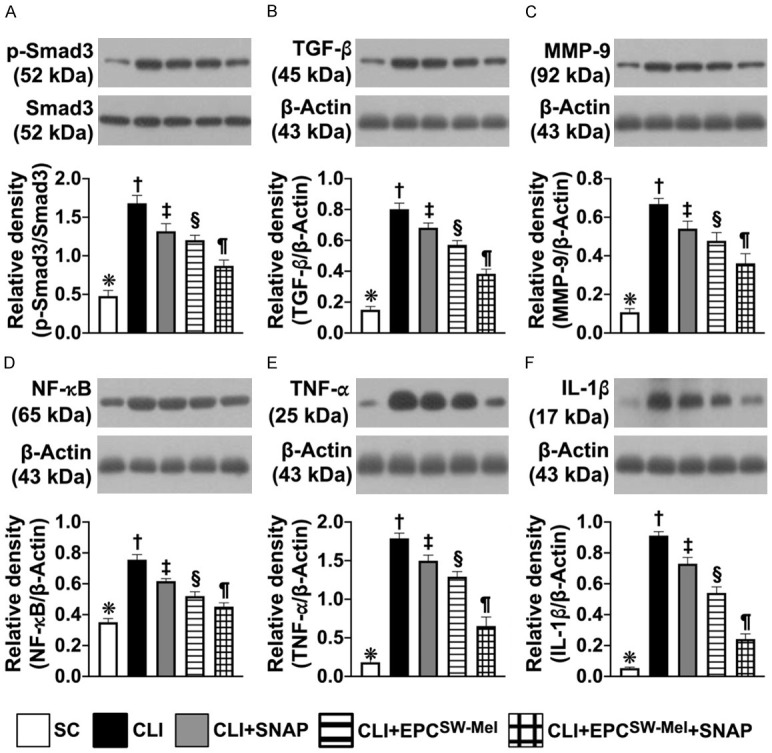
Results: An in vitro study showed that at time points of 24/48/72 h, the cell viability/protein expression of endothelial nitric oxide synthase (eNOS)/and cellular expression of nitric oxide (NO) were highest in EPCs, lowest in EPCs + menadione, and much higher in EPCSW-Mel + Mena than in EPCs + Mena + Mel. Protein levels of oxidative-stress (NOX-1/NOX-2/oxidized protein)/early (AN-V+/PI-)/late (AN-V+/PI+) apoptosis and total intracellular/mitochondrial reactive oxygen species ROS exhibited an antithetical trend of cell viability among the groups (all P<0.0001). Matrigel assay of angiogenesis/positively-stained NO cells showed that they were much higher in EPCs + SNAP than in EPCs only (all P<0.0001). Ex vivo angiogenesis/arterial relaxation of carotid-artery rings were highest in left-common-carotid-artery (LCCA) + SNAP, lowest in LCCA + Mena, and notably higher in LCCA than in LCCA + Mena + SNAP (all P<0.0001). Laser Doppler showed ischemic to normal-blood-flow (INBF) ratio was highest in group 1, lowest in group 2, and it progressively increased from groups 3 to 5 (all P<0.0001). The protein levels of oxidative-stress (NOX-1/NOX-4/oxidized protein)/apoptotic [cleaved-caspase-3/cleaved apoptosis/mitochondrial-damage (cytosolic-cytochrome-C/p-DRP-1)]/fibrotic (Smad3/TGF-β)/inflammatory (MMP-9/IL-1β/TNF-α/NF-κB) biomarkers, exhibited an opposite trend, whereas the protein level of endothelial-cell surface markers (CD31/vWF/eNOS) and number of small vessels exhibited an identical pattern of INBF ratio among the groups (all P<0.0001).

Conclusions: Combined EPCSW-Mel and SNAP therapy offered a synergic effect toward rescuing from CLI.

Keywords: Critical limb ischemia; angiogenesis; endothelial progenitor cells; melatonin; nitric oxide donor; shock wave.


Conflict of interest statement

None.

Figures

Figure 2
Figure 2
Integrity of endothelial function, protein level of oxidative stress, and mitochondrial concentration of Mel in EPCs. (A) Protein expression of phosphorylated endothelial nitric oxide synthase (p-eNOS), * vs. other groups with different symbols (†, ‡, §), P<0.0001. (B) Protein expression of NOX-1, * vs. other groups with different symbols (†, ‡, §), P<0.0001. (C) Protein expression of NOX-2, * vs. other groups with different symbols (†, ‡, §), P<0.0001. (D) Expression of oxidized protein, * vs. other groups with different symbols (†, ‡), P<0.001 (Note: the left and right lanes shown on the upper panel represent protein molecular weight marker and control oxidized molecular protein standard, respectively). M.W. = molecular weight; DNP = 1-3 dinitrophenylhydrazone. (E-H) Immunofluorescent (IF) microscopic finding (400 ×) for identification of positively stained nitric oxide (NO) in EPCs (green color). Blue color indicated DAPI stain (i.e., E-2-H-2) for identification of nuclei. Light green color indicated merged picture (E-3-H-3). (I) Analytical result of number of NO+ cells, * vs. other groups with different symbols (†, ‡, §), P<0.0001. Scale bar in right lower corner represents 20 µm. (J) Mitochondrial concentration of Mel in EPCs, * vs. other groups with different symbols (†, ‡), P<0.0001. All statistical analyses were performed by one-way ANOVA, followed by Bonferroni multiple comparison post hoc test (n = 4 for each group). Symbols (*, †, ‡) indicate significance for each other (at 0.05 level). EPCs = endothelial progenitor cells; Mel = melatonin; Mena = menadione. A1 = EPCs only; A2 = EPCs + Mena; A3 = EPCs + Mena + Mel; A4 = EPCSW-Mel + Mena.
Figure 3
Figure 3
SNAP treatment upregulated angiogenesis, NO production, and generation of soluble angiogenesis factors. A and B. Angiogenesis feature by Matrigel assay showed that the angiogenesis capacity was significantly increased in EPCs treated by SNAP compared to EPCs only (i.e., control group). C. Number of tubules formed (red arrows), * vs. †, P<0.0001. D. Tubule length, * vs. †, P<0.0001. E. Number of clusters formed (pink arrows), * vs. †, P<0.0001. F. Number of networks formation (blue color), * vs. †, P<0.0001. G and H. Immunofluorescent microscopic findings (400 ×) for identification of positively stained nitric oxide (NO) cells (green color) (red arrows). Scale bar in right lower corner represents 20 µm. I. Analytical result of number of NO+ cells, * vs. †, P<0.0001. J. Protein expression of endothelial nitric oxide synthase (eNOS), * vs. †, P<0.0001. K. Protein expression of CD31, * vs. †, P<0.0001. L. Protein expression of von Willebrand factor (vWF), * vs. †, P<0.0001. n = 4 for all groups. SNAP = S-nitroso-N-acetyl-DL-penicillamine; EPCs = endothelial progenitor cells; B1 = EPCs only; B2 = EPCs + SNAP.
Figure 1
Figure 1
Cell viability, cellular apoptosis, and reactive oxygen species (ROS). A. MTT assay for determining the cell viability at time point of 24 h, * vs. other groups with different symbols (†, ‡, §), P<0.0001. B. MTT assay for determining the cell viability at the time point of 48 h, * vs. other groups with different symbols (†, ‡, §), P<0.0001. C. MTT assay for determining the cell viability at the time point of 72 h, * vs. other groups with different symbols (†, ‡, §), P<0.0001. D-G. Flow cytometric analysis for identification of cell apoptosis. H. Flow cytometric analysis for determining the number of early cellular apoptosis cells (AN-V+/PI-), * vs. other groups with different symbols (†, ‡, §), P<0.0001. I. Flow cytometric analysis for determining the number of late cellular (AN-V+/PI+), * vs. other groups with different symbols (†, ‡, §), P<0.0001. J. Flow cytometric analysis for identification of total intracellular ROS. K. Flow cytometric analysis for assessment of mean fluorescent intensity of total intracellular ROS (i.e., stained carboxy-H2DCFDA dye), * vs. other groups with different symbols (†, ‡, §), P<0.0001. L. Flow cytometric analysis for identification of mitochondrial ROS. M. Flow cytometric analysis for assessment of mean fluorescent intensity of mitochondrial ROS, * vs. other groups with different symbols (†, ‡, §), P<0.0001. All statistical analyses were performed by one-way ANOVA, followed by Bonferroni multiple comparison post hoc test (n = 4 for each group). Symbols (*, †, ‡) indicate significance for each other (at 0.05 level). EPCs = endothelial progenitor cells; Mel = melatonin; Mena = menadione. A1 = EPCs only; A2 = EPCs + Mena; A3 = EPCs + Mena + Mel; A4 = EPCSW-Mel + Mena.
Figure 4
Figure 4
Ex vivo culture of carotid artery angiogenesis. (A-D) Light microscopic findings (i.e., photographic images) (100 ×) of carotid ring culturing in groups A (i.e., SC) (A-1, A-2), B (B-1, B-2), C (C-1, C-2), and D (D-1, D-2), respectively. Scale bar in right lower corner represents 100 µm. (E) Analytical results of sprout area, * vs. other groups with different symbols (†, ‡, §), P<0.0001. (F) Analytic result of mean sprout front distance, * vs. other groups with different symbols (†, ‡, §), P<0.0001. All statistical analyses were performed by one-way ANOVA, followed by Bonferroni multiple comparison post-hoc test (n = 6 for each group). Symbols (*, †, ‡, §) indicate significance at 0.05 level. LCCA = left common carotid artery; SNAP = S-nitroso-N-acetyl-DL-penicillamine; Men = menadione; group A (LCCA only), group B (LCCA + SNAP), group C (LCCA + Men) and group D (LCCA + Men + SNAP).
Figure 5
Figure 5
Ex vivo carotid artery relaxation and NO release. A. Schematic illustration of NO release from endothelial cells of LCCA from sham-control group (A1) indicating the native endothelial cells (ECs) of LCCA without any pretreatment. On the other hand, A2 to A4 groups were pretreated by L-NAME (100 µM) for 30 minutes. NO release (%) was significantly attenuated in A2 (i.e., LCCA + SNAP) as compared to the A1. It was further significantly attenuated in A3 (LCCA + Men). This was partially but significantly reversed in A4 (LCCA + Men + SNAP), implying that SNAP plays a crucial role in stimulating the ECs to release NO. Analytical result of NO release (%) among the four groups, * vs. other groups with different symbols (†, ‡, §), P<0.0001. B. Phenylephrine (PE) concentration-response curves (i.e., tension) in LCCA. The cumulative concentration-response curve of LCCA constriction normalized to 90 mM potassium chloride (KC)-induced contraction. The 4 curves, indicating the 4 individual groups, illustrated a stepwise-increased concentration of PE-induced increase in vasoconstriction. This was significantly and progressively increased in group C compared to other groups. Analytical result of vasoconstriction (%), * vs. other groups with different symbols (†, ‡, §) at point a, P<0.0001. Additionally, analytical result of vasoconstriction (%), * vs. other groups with different symbols (†, ‡) at points b, c and d [i.e., among the groups in different points (i.e., b, c, d) of concentrations], P<0.0001. C. The LCCA dilation response to Acetylcholinesterase (ACh) (1.0 × 10⁻⁸ to 3.0 × 10⁻³ M) treatment is presented with respect to the percentage of the contractile response that was induced by phenylephrine (PE, 10-6 M). Additionally, Ach-induced vasorelaxation was significantly reduced in group B versus other groups. Analytical result of vasorelaxation (%), * vs. other groups with different symbols (†, ‡), P<0.0001, i.e., * vs. other groups with different symbols (†, ‡) at points a, b and c [i.e., among the four groups in different points (i.e., a, b, c) of concentration] and * vs. other groups with different symbols (†, ‡, §) at point d. All statistical analyses were performed by one-way ANOVA, followed by Bonferroni multiple comparison post-hoc test (n = 6 for each group). Symbols (*, †, ‡, §) indicate significance (at 0.05 level). LCCA = left common carotid artery; SNAP = S-nitroso-N-acetyl-DL-penicillamine; Men = menadione; NO = nitric oxide; group A (LCCA only), group B (LCCA + SNAP), group C (LCCA + Men) and group D (LCCA + Men + SNAP).
Figure 6
Figure 6
Ischemic to normal blood flow (INBF) ratio analyzed by laser Doppler scan by days 0, 1, 7, and 14 after conducting left CLI induction. A-E. Laser Doppler finding of ratio of left limb (ischemia) to right limb (normal) blood flow (i.e., INBF) at day 0 prior to CLI procedure among the five groups. F. Analytical result of ratio of INBF, P>0.5. G-K. Laser Doppler finding of INBF at day 1 after CLI induction among the five groups. L. Analytical result of ratio of INBF, * vs. †, P<0.0001, P<0.0001. M-Q. Laser Doppler finding of ratio of INBF at day 7 after CLI induction among the five groups. R. Analytical result of ratio of INBF, * vs. other groups with different symbols (†, ‡, §), P<0.0001. S-W. Laser Doppler finding of ratio of INBF at day 14 after CLI procedure among the five groups. X. Analytical result of ratio of INBF, * vs. other groups with different symbols (†, ‡, §), P<0.0001. All statistical analyses were performed by one-way ANOVA, followed by Bonferroni multiple comparison post hoc test (n = 10 for each group). Symbols (*, †, ‡, §) indicate significance (at 0.05 level). CLI = critical limb ischemia; SNAP = S-nitroso-N-acetyl-DL-penicillamine; SC = sham-operated control; EPCSW-Mel = extracorporeal shock wave (ECSW) facilitated melatonin (Mel) delivery into autologous endothelial progenitor cells (EPCs); group 1 = SC; group 2 = CLI; group 3 = CLI + SNAP; group 4 = CLI + EPCSW-Mel; group 5 = CLI + EPCSW-Mel + SNAP.
Figure 7
Figure 7
Protein expressions of oxidative stress, apoptosis, and mitochondrial damage in CLI by day 14 after CLI induction. A. Protein expression of NOX-1, * vs. other groups with different symbols (†, ‡, §), P<0.0001. B. Protein expression of NOX-4, * vs. other groups with different symbols (†, ‡, §), P<0.0001. C. The oxidized protein expression, * vs. other groups with different symbols (†, ‡, §, ¶), P<0.0001 (Note: the left and right lanes shown on the upper panel represent protein molecular weight marker and control oxidized molecular protein standard, respectively). M.W. = molecular weight; DNP = 1-3 dinitrophenylhydrazone. D. Protein expression of cleaved caspase 3 (c-Casp3), * vs. other groups with different symbols (†, ‡, §, ¶), P<0.0001. E. Protein expression of cleaved poly (ADP-ribose) polymerase (c-PARP), * vs. other groups with different symbols (†, ‡, §), P<0.0001. F. Protein expression of cytosolic cytochrome C (cyt-CytoC), * vs. other groups with different symbols (†, ‡, §, ¶), P<0.0001. G. Protein expression of mitochondrial cytochrome C (mit-CytoC), * vs. other groups with different symbols (†, ‡, §, ¶), P<0.0001. H. Protein expression of phosphorylated dynamin-1-like protein (p)-DRP-1, * vs. other groups with different symbols (†, ‡, §, ¶), P<0.0001. All statistical analyses were performed by one-way ANOVA, followed by Bonferroni multiple comparison post hoc test (n = 6 for each group). Symbols (*, †, ‡, §, ¶) indicate significance (at 0.05 level). SC = sham-operated control; EPCSW-Mel = extracorporeal shock wave (ECSW) facilitated melatonin (Mel) delivery into autologous endothelial progenitor cells (EPCs); CLI = critical limb ischemia; SNAP = S-nitroso-N-acetyl-DL-penicillamine; group 1 = SC; group 2 = CLI; group 3 = CLI + SNAP; group 4 = CLI + EPCSW-Mel; group 5 = CLI + EPCSW-Mel + SNAP.
Figure 8
Figure 8
Protein expressions of endothelial cell surface markers, small vessel density, and angiogenesis biomarkers in CLI by day 14 after CLI induction. A. Protein expression of CD31, * vs. other groups with different symbols (†, ‡, §, ¶), P<0.0001. B. Protein expression of stromal-cell derived factor 1 alpha (SDF-1α), * vs. other groups with different symbols (†, ‡, §, ¶), P<0.0001. C. Protein expression of von Willebrand factor (vWF), * vs. other groups with different symbols (†, ‡, §, ¶), P<0.0001. D-H. Microscopic findings (100 ×) for identification of positively-stained alpha smooth muscle actin (α-SMA) small vessels (gray color, red arrows)). I. Number of small vessels (i.e., defined as diameter ≤25.0 μM), * vs. other groups with different symbols (†, ‡, §), P<0.0001. J. Protein expression of endothelial nitric oxide synthase (eNOS), * vs. other groups with different symbols (†, ‡, §, ¶), P<0.0001. K. Protein expression of vascular endothelial growth factor (VEGF), * vs. other groups with different symbols (†, ‡, §, ¶), P<0.0001. All statistical analyses were performed by one-way ANOVA, followed by Bonferroni multiple comparison post-hoc test (n = 6 for each group). Symbols (*, †, ‡, §, ¶) indicate significance (at 0.05 level). SC = sham-operated control; EPCSW-Mel = extracorporeal shock wave (ECSW) facilitated melatonin (Mel) delivery into autologous endothelial progenitor cells (EPCs); SNAP = S-nitroso-N-acetyl-DL-penicillamine; group 1 = SC; group 2 = CLI; group 3 = CLI + SNAP; group 4 = CLI + EPCSW-Mel; group 5 = CLI + EPCSW-Mel + SNAP.
Figure 9
Figure 9
Protein expressions of fibrotic and inflammatory biomarkers in CLI by day 14 after CLI induction. A. Protein expression of phosphorylated (p)-Smad3, * vs. other groups with different symbols (†, ‡, §, ¶), P<0.0001. B. Protein expression of transforming growth factor beta (TGF-β), * vs. other groups with different symbols (†, ‡, §, ¶), P<0.0001. C. Protein expression of matrix metalloproteinase (MMP)-9, * vs. other groups with different symbols (†, ‡, §, ¶), P<0.0001. D. Protein expression of phosphorylated (p) nuclear factor (NF)-κB, * vs. other groups with different symbols (†, ‡, §, ¶), P<0.0001. E. Protein expression of tumor necrosis factor (TNF)-α, * vs. other groups with different symbols (†, ‡, §, ¶), P<0.0001. F. Protein expression of interleukin (IL)-1β, * vs. other groups with different symbols (†, ‡, §, ¶), P<0.0001. All statistical analyses were performed by one-way ANOVA, followed by Bonferroni multiple comparison post-hoc test (n = 6 for each group). Symbols (*, †, ‡, §, ¶) indicate significance (at 0.05 level). SC = sham-operated control; EPCSW-Mel = extracorporeal shock wave (ECSW) facilitated melatonin (Mel) delivery into autologous endothelial progenitor cells (EPCs); CLI = critical limb ischemia; SNAP = S-nitroso-N-acetyl-DL-penicillamine; group 1 = SC; group 2 = CLI; group 3 = CLI + SNAP; group 4 = CLI + EPCSW-Mel; group 5 = CLI + EPCSW-Mel + SNAP.
Figure 10
Figure 10
Schematic figure of the underlying mechanism of EPCSW-Mel and SNAP treatment on restoring the blood flow to the CLI area and rescuing the critical limb. CLI = critical limb ischemia; SNAP = S-nitroso-N-acetyl-DL-penicillamine; EPCs = endothelial progenitor cells; ECSW = extracorporeal shock wave; ROS = reactive oxygen species; cyt-cyt C = cytosolic cytochrome C; SDF-1α = stromal cell-derived factor 1 alpha.

References

    1. Criqui MH, Aboyans V. Epidemiology of peripheral artery disease. Circ Res. 2015;116:1509–1526. - PubMed
    1. Fowkes FG, Rudan D, Rudan I, Aboyans V, Denenberg JO, McDermott MM, Norman PE, Sampson UK, Williams LJ, Mensah GA, Criqui MH. Comparison of global estimates of prevalence and risk factors for peripheral artery disease in 2000 and 2010: a systematic review and analysis. Lancet. 2013;382:1329–1340. - PubMed
    1. Lawall H, Huppert P, Espinola-Klein C, Rumenapf G. The diagnosis and treatment of peripheral arterial vascular disease. Dtsch Arztebl Int. 2016;113:729–736. - PMC - PubMed
    1. Song P, Rudan D, Zhu Y, Fowkes FJI, Rahimi K, Fowkes FGR, Rudan I. Global, regional, and national prevalence and risk factors for peripheral artery disease in 2015: an updated systematic review and analysis. Lancet Glob Health. 2019;7:e1020–e1030. - PubMed
    1. Vemulapalli S, Patel MR, Jones WS. Limb ischemia: cardiovascular diagnosis and management from head to toe. Curr Cardiol Rep. 2015;17:611. - PubMed

LinkOut - more resources