[Preprint]. 2024 Sep 28:2024.09.27.24314494.
doi: 10.1101/2024.09.27.24314494.

Lipid Trajectories Improve Risk Models for Alzheimer's Disease and Mild Cognitive Impairment

Affiliations

Lipid Trajectories Improve Risk Models for Alzheimer's Disease and Mild Cognitive Impairment

Bruce A Chase et al. medRxiv. .

Update in

Abstract

To assess the relationship between lipids and cognitive dysfunction, we retrospectively analyzed blood-lipid levels in clinically well-characterized individuals with stable mild cognitive impairment (MCI) or Alzheimer's disease (AD) over the decade prior to first cognitive symptoms. In this case/control cohort study, AD and MCI cases were diagnosed using DSM-IV criteria; MCI cases had not progressed to dementia for ≥5 years; and controls were propensity matched to cases at age of symptom onset (MCI: 116 cases, 435 controls; AD: 215 cases, 483 controls). Participants were grouped based on longitudinal trajectories and quintile of variability independent of the mean (VIM) for total cholesterol, HDL-C, LDL-C, non-HDL-C and ln(triglycerides). Models for the risk of cognitive dysfunction evaluated trajectory and VIM groups, APOE genotype, polygenic risk scores (PRS) for AD and lipid levels, age, comorbidities, and longitudinal correlates of blood-lipid concentrations. Lower HDL-C trajectories (OR = 3.8, 95% CI = 1.3-11.3) and the lowest VIM quintile of non-HDL-C (OR = 2.2, 95% CI = 1.3-3.0) were associated with higher MCI risk. Lower HDL-C trajectories (OR = 3.0, 95% CI = 1.6-5.7) and the lowest VIM quintile of total cholesterol (OR = 2.4, 95% CI = 1.5-3.9) were associated with higher AD risk. The inclusion of lipid-trajectory and VIM groups improved risk-model predictive performance independent of APOE genotype or PRS for AD and lipid levels. These results provide an important real-world perspective on the influence of lipid metabolism and blood-lipid levels on the development of stable MCI and AD.

Keywords: APOE; Alzheimer’s disease; HDL-C; LDL; cholesterol; group-based trajectory analysis; lipids; polygenic risk score; triglycerides; variability independent of the mean.


Figures

Figure 1:
Figure 1:. Selection of AD and MCI case/control cohorts.
Case/control cohorts were selected from genotyped patients enrolled in the DodoNA project. Cases were selected from patients who were followed with a structured clinical documentation toolkit for memory disorders. AD (AD or mixed AD/vascular dementia) and MCI diagnoses utilized DSM-IV criteria. Exclusion criteria for cases were: normal cognition upon evaluation, an inconclusive diagnosis, a diagnosis of vascular dementia (only), Lewy body dementia, frontotemporal dementia, or cognitive impairment or dementia associated with another condition (parkinsonism, stroke, normal pressure hydrocephalus, cortical basal degeneration, progressive supranuclear palsy, stroke, alcohol use, end-stage-renal disease, subdural hematoma, B12 deficiency, a psychiatric disorder, or radiation therapy). AD and MCI cases were excluded if they had < 3 blood-lipid measurements in the decade prior to first symptom onset, and MCI cases were included only if MCI did not progress to dementia for at least five years. Controls were selected from patients enrolled in studies of other neurological diseases or a brain-health cohort (see Table 1). Controls did not have an ICD code for dementia or cognitive impairment (see Methods), any diagnosis of neurodegenerative disease, and had ≥ 3 blood lipid measurements. Cases were propensity-score matched to controls based on the criteria shown and controls were retained only if they had ≥ 3 blood-lipid measurements in the decade prior to their matching age. The number of cases and controls in each cohort, and the number with European ancestry (EUR), is shown.
Figure 2:
Figure 2:. Age at first cognitive symptom in (A) AD and (B) MCI cases. Compare to Table 2.
Figure 3:
Figure 3:. Lipid trajectories in AD and MCI case/control cohorts.
Controls were propensity matched (see text and Table 2 for details) with cases at age of first symptom onset. Total cholesterol and lipid subtype measurements collected over the decade prior to the year of first symptom onset (cases) and matching age (controls) were fit to group-based trajectory models that were developed using blood-cholesterol lowering medication use as a time-dependent covariate. The plots show the best-fitting trajectory for each group for mean lipid values at each year (Group 1: solid lines with open circles; Group 2: long-dashed lines with open squares; Group 3: short-dashed lines with open triangles). For each trajectory, 95% confidence intervals (polynomial-fit) are indicated (dotted lines). Trajectories are shown for total cholesterol (A, F); HDL-C (B, G); non-HDL-C (C, H); LDL-C, (D, I); and ln(triglycerides), (E, J) for the AD, MCI case/control cohorts, respectively. Compare to Table 3.
Figure 4:
Figure 4:. Blood-cholesterol lowering medication use in the AD and MCI case/control cohorts.
Blood-cholesterol lowering medication use at age of first symptom onset (cases) did not differ from controls, at age match, in either the MCI (A) or AD (B) cohorts. Blood-cholesterol lowering medication use increased with increasing quintile of non-HDL-C variability independent of the mean (VIM) in the MCI case/control cohort (C) and with increasing quintile of total cholesterol VIM in the AD case/control cohort (D). Compare to Table 5.
Figure 5:
Figure 5:. Models evaluating the contributions of lipid trajectory group and lipid variability independent of the mean (VIM) to risk of AD or MCI.
Covariate-adjusted logistic regression models were developed using backwards selection and the Akaike information criterion to evaluate whether lipid trajectory groups and lipid VIM showed associations with AD or MCI risk. The covariates evaluated in these models are described in the text. Odds ratios (pink diamonds), 95% confidence intervals (blue bars), and significance are shown for covariates retained in the best fitting models for AD risk (A) and MCI risk (B) that considered polygenic risk scores for AD, including the APOE region, and lipids. Since these risk scores were mostly developed using data from genome-wide association studies in European (EUR) populations, these models were developed for the subset of study subjects with EUR ancestry. Panels E and F show odds ratios and 95% confidence intervals for covariates retained in models of AD risk (E) and MCI risk (F) that considered APOE-ε4 genetic status without polygenic risk scores and included all ancestries. Panels C, D, G, and H show the area under the receiver operating characteristic curve (AUROC) and scores for models with (i) only the base covariates, (ii) base covariates and polygenic risk scores or APOE-ε4 genotype, (iii) base covariates with lipid groups (lipid trajectory and VIM quintile groups), and (iv) base covariates, polygenic risk scores or APOE-ε4 genotype, and lipid groups. The Bonferroni-corrected p value is from a test of equality of area under these four curves. Compare panels A, B, E, and F to Table 6.
Figure 6:
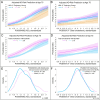
Figure 6:. Contributions of HDL-C trajectory group and lowest VIM quintile for total cholesterol to AD risk, relative to AD and total cholesterol polygenic risk scores.
The covariate-adjusted AD-risk model summarized in Figure 5A and Table 6 was used to estimate contributions to AD risk relative to polygenic risk scores for AD and total cholesterol. Panel (A) shows the predictive margins for HDL-C trajectory groups and panel (C) for quintiles of total-cholesterol VIM over a range of values of PGS004092 (AD) at age 75 and at mean values of other covariates. Panel (B) shows the predictive margins for HDL-C trajectory groups and panel (D) for the lowest quintile of total-cholesterol VIM over a range of values of PGS003137 (total cholesterol) at age 75 and at mean values of other covariates. Lines show the predicted AD risk; shaded areas indicate 95% confidence intervals. In panels E and F, kernel-density plots obtained using an Epanechnikov kernel function illustrate the distribution of each polygenic risk score in AD cases and matched controls. A Kolmogorov-Smirnov test evaluated the equality of the distribution of each polygenic risk score in cases and controls.
Figure 7:
Figure 7:. Contributions of HDL-C trajectory groups and the lowest quintile of total cholesterol VIM to AD risk, relative to APOE-ε4 genotype.
The covariate-adjusted AD-risk model summarized in Figure 4E and Table 6 was used to estimate contributions to AD risk relative to APOE-ε4 genotype. Panels at left show the predictive margins for HDL-C trajectory groups over ages 65 to 85 and at mean values of other covariates in non-APOE-ε4 genotypes (A), APOE-ε4 heterozygotes (C), and APOE-ε4 homozygotes (E). Panels at right show the predictive margins for quintiles of total cholesterol VIM over ages 65 to 85 and at mean values of other covariates in non-APOE-ε4 genotypes (B), APOE-ε4 heterozygotes (D), and APOE-ε4 homozygotes (F). Lines indicate predicted AD risk; shaded areas indicate 95% confidence intervals. Bar plots (bottom panels) show the distribution of HDL-C trajectory groups (G) and lowest total-cholesterol VIM quintile groups (H) across APOE-ε4 genotypes. A χ2-contingency test evaluated whether the distribution of HDL-C trajectory groups or total-cholesterol VIM quintiles differed across APOE-ε4 genotypes.
Figure 8:
Figure 8:. Contributions of HDL-C trajectory groups and the lowest quintile of total non-HDL-C VIM to MCI risk, relative to an AD polygenic risk score.
The covariate-adjusted MCI-risk model summarized in Figure 4B and Table 6 was used to estimate contributions to MCI risk relative to an AD polygenic risk score (PRS, PGS004092). (A) Predictive margins for 5th, 50th, and 95th percentile AD PRS scores for subjects aged 65–85, at mean values of other covariates. (B) Predictive margins of HDL-C trajectory groups at age 75 over a range of AD PRS scores and at mean values of other covariates. (C) Predictive margins of the lowest quintile of total-cholesterol VIM at age 75 over a range of values of AD PRS scores and at mean values of other covariates. Lines illustrate predicted MCI risk; shaded areas indicate 95% confidence intervals. In panel D, kernel-density plots obtained using an Epanechnikov kernel function illustrate the distribution of the AD PRS scores in MCI cases and matched controls. A Kolmogorov-Smirnov test evaluated the equality of the distribution of the PRS in cases and controls.
Figure 9:
Figure 9:. Contributions of HDL-C trajectory groups and the lowest quintile of non-HDL-C VIM to MCI risk, relative to APOE-ε4 genotype.
The covariate adjusted MCI-risk model summarized in Figure 5F and Table 6 was used to estimate contributions to MCI risk, relative to APOEε4 genotype. Panels at left show the predictive margins for HDL-C trajectory groups for subjects aged 50–85 and at mean values of other covariates in (A) non-APOE-ε4 genotypes, (C) APOE-ε4 heterozygotes, and (E) APOE-ε4 homozygotes. Panels at right show the predictive margins for the lowest quintile of non-HDL-C VIM for ages 50–85 and at mean values of other covariates in (B) non-APOE-ε4 genotypes, (D) APOE-ε4 heterozygotes, and (F) APOE-ε4 homozygotes. Lines illustrate the predicted MCI risk; shaded areas indicate 95% confidence intervals. Bar plots (bottom panels) show the distribution of (G) HDL-C trajectory groups and (H) lowest total-cholesterol VIM quintile across APOE-ε4 genotypes. χ2-contingency tests evaluated whether the distribution of HDL-C trajectory groups or non-HDL-C VIM quintile groups differed across APOE-ε4 genotypes.

Similar articles

References

    1. Nichols E, Steinmetz J, Vollset S, Fukutaki K, Chalek J, Abd-Allah F, et al. Estimation of the global prevalence of dementia in 2019 and forecasted prevalence in 2050: an analysis for the Global Burden of Disease Study 2019. Lancet Public Health. 2022. Jan 1;7(2):E105–25. - PMC - PubMed
    1. Rajan KB, Weuve J, Barnes LL, McAninch EA, Wilson RS, Evans DA. Population estimate of people with clinical Alzheimer’s disease and mild cognitive impairment in the United States (2020–2060). Alzheimers Dement J Alzheimers Assoc. 2021. Dec;17(12):1966–75. - PMC - PubMed
    1. Cesari M, Grande G, Canevelli M, Vanacore N, Bruno G, Quarchioni E, et al. Spontaneous Reversion of Mild Cognitive Impairment to Normal Cognition: A Systematic Review of Literature and Meta-Analysis. 2016. Jan 1; - PubMed
    1. Varma VR, Büşra Lüleci H, Oommen AM, Varma S, Blackshear CT, Griswold ME, et al. Abnormal brain cholesterol homeostasis in Alzheimer’s disease—a targeted metabolomic and transcriptomic study. Npj Aging Mech Dis. 2021. Dec 1;7(1). - PMC - PubMed
    1. Dyslipidemia Reitz C. and dementia: current epidemiology, genetic evidence and mechanisms behind the associations. J Alzheimers Dis. 2013;30(2):S127–45. - PMC - PubMed

Publication types

LinkOut - more resources