[Preprint]. 2024 Sep 25:2024.09.24.24314303.
doi: 10.1101/2024.09.24.24314303.

Unmasking Neuroendocrine Prostate Cancer with a Machine Learning-Driven 7-Gene Stemness Signature that Predicts Progression

Affiliations

Unmasking Neuroendocrine Prostate Cancer with a Machine Learning-Driven 7-Gene Stemness Signature that Predicts Progression

Agustina Sabater et al. medRxiv. .

Update in

Abstract

Prostate cancer (PCa) poses a significant global health challenge, particularly due to its progression into aggressive forms like neuroendocrine prostate cancer (NEPC). This study developed and validated a stemness-associated gene signature using advanced machine learning techniques, including Random Forest and Lasso regression, applied to large-scale transcriptomic datasets. The resulting 7-gene signature (KMT5C, MEN1, TYMS, IRF5, DNMT3B, CDC25B and DPP4) was validated across independent cohorts and patient-derived xenograft (PDX) models. The signature demonstrated strong prognostic value for progression-free, disease-free, relapse-free, metastasis-free, and overall survival. Importantly, the signature not only identified specific NEPC subtypes, such as large-cell neuroendocrine carcinoma, which is associated with very poor outcomes, but also predicted a poor prognosis for PCa cases that exhibit this molecular signature, even when they were not histopathologically classified as NEPC. This dual prognostic and classifier capability makes the 7-gene signature a robust tool for personalized medicine, providing a valuable resource for predicting disease progression and guiding treatment strategies in PCa management.

Keywords: Gene signature; Large Cell Neuroendocrine Carcinoma; Machine Learning; Neuroendocrine Transdifferentiation; Prognosis; Prostate Cancer; Stemness.


Conflict of interest statement

DECLARATION OF COMPETING INTEREST The authors declare no conflict of interest.

Figures
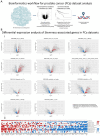
Figure 1.
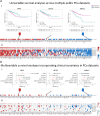
Figure 1.. Stemness-associated gene expression changes in PCa patient samples using multiple public datasets.
A) Schematic representation of gene selection, transcriptomics and survival analyses to define potential prognostic biomarkers. B) i) Volcano plots showing the results of the differential expression analysis of all available genes within the included transcriptomics datasets. Red = significantly upregulated stemness-associated gene. Blue = significantly downregulated stemness-associated gene. Dark gray = Non-significantly dysregulated stemness-associated genes. Light gray = other genes available in the dataset. ii) Summary heatmap of the transcriptomics analyses performed in multiple publicly available datasets (n=1259). Genes of interest and the results of the differential expression analysis for each dataset are displayed. Each row represents the results of a specific comparison. Annotation depicts the absolute number of comparisons in which each gene is up (red) or downregulated (blue). Red = significantly upregulated gene. Blue = significantly downregulated gene. White = not significant changes. Gray = non available. Datasets: GSE35988 (n=122); GSE3933 (n=103); GSE46602 (n=50); GSE6956 (n=87); GSE70768 (n=179); TCGA-PRAD (n=548); GSE21034 (n=150). Statistical significance was set to adjusted p value<0.05.
Figure 2.
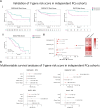
Figure 2.. Uni and multivariable survival analysis.
A) i) Examples of Kaplan-Meier (KM) curves depicting the association of each gene to the risk of event (purple = high expression of a gene; green: low expression of a gene). HR: Hazard Ratio; Cox P: p-value from the Cox proportional hazards model. Log-rank P: p value of the log-rank test. ii) Summary heatmap of the univariable survival analyses performed on multiple datasets. The red box indicates that high gene expression is associated with a high risk of an event (HR>1 and Cox P<0.05), blue boxes indicate that high gene expression is associated with a low risk of survival-related events (HR<1 and Cox P<0.05) and white boxes indicate that there are no significant associations between gene expression and risk of an event. Gray = gene no available. Patients were stratified by the median expression of each gene. B) i) Examples of forest plots depicting the association of each gene to the risk of event adjusted for all available covariates using the TCGA-PRAD dataset. ii) Summary heatmap of the multivariable survival analyses performed on multiple datasets. The red box indicates that high gene expression is associated with a high risk of an event (HR>1 and Cox P<0.05), blue boxes indicate that high gene expression is associated with a low risk of survival-related events (HR<1 and Cox P<0.05) and white boxes indicate that there are no significant associations between gene expression and risk of an event. Gray = gene no available. All comparisons consider low-expression patients as the reference group. Annotation depicts the absolute number of comparisons in which high expression of each gene is associated with high (red) or low (blue) risk. OS: Overall Survival; DSS: Disease-Specific Survival; PFS: Progression-Free Survival; RFS: Relapse-Free Survival; MFS: Metastasis-Free Survival. Datasets: TCGA-PRAD (n=497 PFS, n=337 DFS); GSE70768 (n=111 RFS); GSE70769 (n=92 RFS); GSE116918 (n=248 RFS and MFS); GSE16560 (n=281 OS). Statistical significance was set at Cox P<0.05. **Cox P<0.01; ***Cox P<0.001.
Figure 3.
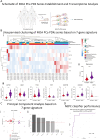
Figure 3.. Machine learning Random Forest algorithm for prognostic candidates’ selection.
A) Heatmap summarizing the relative importance of the variables (genes) for all training datasets. The relative importance was converted into percentiles, where 1 represents maximum relative importance (red) and 0 indicates minimum relative importance (blue). Gray = gene not available in the dataset. The 15 top-ranked genes (purple) were selected as candidates for our stemness-associated risk signature. B) i) Example of Kaplan-Meier (KM) curve using the TCGA-PRAD dataset depicting the association of the 7-gene score to the risk of progression (purple = high 7-gene score; green: low 7-gene score). The coefficients for each gene were calculated by Lasso regression using TCGA-PRAD data, and the 7-gene score was constructed as follows: 0.284×KMT5C − 0.0597×DPP4 + 0.2178×TYMS + 0.048×CDC25B + 0.09×IRF5 + 0.2723×MEN1 + 0.0827×DNMT3B. Patients were stratified by the median of the score. HR: Hazard Ratio; p-value: p-value from the Cox proportional hazards model. Log-rank P: p value of the log-rank test. ii) Summary forest plot displaying the survival analysis of the association of the 7-gene signature with the risk of disease progression-events in the training datasets. Patients survival was analysed by either stratification by the median of the 7-gene score (circles) or taking the 7-gene score as a continuous variable (squares). On the right, heatmap depicting the concordance index value for each of the analyses. The concordance index is a performance measure of the signature within each dataset. Cox P = p-value of the Cox regression coefficient. HR = Hazard Ratio. (95% CI) = 95% Confidence Interval. PFS: Progression-Free Survival; DFS: Disease-Free Survival; RFS: Relapse-Free Survival; OS: Overall Survival; MFS: Metastasis-Free Survival. Statistical significance was set at Cox P<0.05. *Cox P<0.05; **Cox P<0.01; ***Cox P<0.001; ****Cox P<0.0001.
Figure 4.
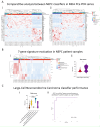
Figure 4.. Gene signature’s performance across external validation datasets
A) i) Kaplan-Meier curves depicting the association of the 7-gene score to the risk of disease progression-events included in the validation datasets. The coefficients for each gene were calculated by Lasso regression using TCGA-PRAD data, and the 7-gene score was calculated as follows: 0.284×KMT5C + 0.2723×MEN1 + 0.2178×TYMS + 0.09×IRF5 + 0.0827×DNMT3B + 0.048×CDC25B − 0.0597×DPP4. Patients were stratified by the median of the score. HR: Hazard Ratio; Cox P: p-value from the Cox proportional hazards model. Log-rank P: p value of the log-rank test. ii) Summary forest plot displaying the survival analysis of the association of the 7-gene signature with the risk of disease progression-events in the validation datasets. Patients survival was analysed by either stratification by the median of the 7-gene score (circles) or taking the 7-gene score as a continuous variable (squares). On the right, heatmap depicting the concordance index value for each of the analyses. The concordance index (CI) is a performance measure of the signature within each dataset. RFS: Relapse-Free Survival; OS: Overall Survival. B) Forest plots depicting the association of each gene to the risk of event adjusted for all available covariates within each validation dataset. Cox P = p-value of the Cox regression coefficient. HR = Hazard Ratio. [95% CI] = 95% Confidence Interval. Datasets: GSE54460 (n=106); GSE94767 (n=233); DKFZ (n=81); SU2C-PCF (n=81).Statistical significance was set at Cox P<0.05. *Cox P<0.05; **Cox P<0.01; ***Cox P<0.001; ****Cox P<0.0001.
Figure 5.
Figure 5.. Transcriptome analysis of the MDA PCa PDX series.
A) Schematic representation of the MDA PCa PDX series establishment and transcriptome analysis (n=44) (created with BioRender.com). B) i) Heatmap depicting unsupervised clustering analysis of RNAseq data from the 44 MDA PCa PDXs considering the expression of the 7-gene signature (KMT5C, MEN1, TYMS, IRF5, DNMT3B, CDC25B and DPP4). Red, white, and blue represent greater, intermediate, and lower gene expression levels. ii) Violin plot showing the 7-gene score levels in no-NEPC and NEPC samples from the MDA PCa PDX series. iii) Violin plots showing the expression levels (FPKM) of the genes included in the 7-gene score in no-NEPC and NEPC samples from the MDA PCa PDX series. C) i) PCA biplot considering the expression of the 7-gene signature using the MDA PCa PDX data assessed by RNA-seq. Each point represents one PDX. Samples are coloured according to the histopathological classification: adenocarcinoma (red), sarcomatoid (beige) and neuroendocrine (purple). ii) Bar plot showing the contribution (%) of each gene in the signature to the variance in the PC1 from the PCA. D) ROC curve showing the performance of the 7-gene score in classifying MDA PCa PDXs as NEPC. Statistical significance was calculated using Student’s t test and was set at p<0.0.5. *p<0.05; **p<0.01; ***p<0.001; ****p<0.0001.
Figure 6.
Figure 6.. Clinical validation in NEPC samples.
A) i) Heatmap depicting an unsupervised clustering analysis of RNAseq data from the MDA PCa PDX series considering the expression of the 70-gene signature proposed by Beltran et al. [12] ii) Heatmap depicting an unsupervised clustering analysis of RNAseq data from the MDA PCa PDX series considering the expression of the 70-gene signature proposed by Beltran et al. plus the 7 genes (KMT5C, MEN1, TYMS, IRF5, DNMT3B, CDC25B and DPP4) from the risk score model propose in our work. B) i) Heatmap depicting an unsupervised clustering analysis of RNAseq data from human patients in Beltran et al., dataset (n=49) [12] considering the expression of the 7-gene signature. Red, white, and blue represent greater, intermediate, and lower gene expression levels. Expression values are presented as z-scores. ii) Violin plot showing 7-gene score levels in CRPC-Adeno and CRPC-NE samples from the Beltran et al., dataset. C) i) Violin plot showing risk score levels in samples from the Beltran et al., dataset according to the histological classification: prostate adenocarcinoma without neuroendocrine differentiation, prostate adenocarcinoma with neuroendocrine differentiation >20%, small-cell carcinoma, large-cell neuroendocrine carcinoma, and mixed small-cell carcinoma–adenocarcinoma. ii) ROC curve showing the performance of the 7-gene score in classifying PCa patient samples from Beltran et al. dataset as Large-Cell NEPC. Statistical significance was calculated using Student’s t test or ANOVA followed by Tukey’s test, and was set at p<0.05. **p<0.01; ****p<0.0001.

References

    1. Global Cancer Statistics 2022: GLOBOCAN Estimates of Incidence and Mortality Worldwide for 36 Cancers in 185 Countries - Bray - 2024 - CA: A Cancer Journal for Clinicians - Wiley Online Library Available online: https://acsjournals.onlinelibrary.wiley.com/doi/10.3322/caac.21834 (accessed on 18 July 2024). - DOI - PubMed
    1. Beltran H.; Rickman D.S.; Park K.; Chae S.S.; Sboner A.; MacDonald T.Y.; Wang Y.; Sheikh K.L.; Terry S.; Tagawa S.T.; et al. Molecular Characterization of Neuroendocrine Prostate Cancer and Identification of New Drug Targets. Cancer Discov. 2011, 1, 487–495, doi:10.1158/2159-8290.CD-11-0130. - DOI - PMC - PubMed
    1. Robinson D.; Van Allen E.M.; Wu Y.-M.; Schultz N.; Lonigro R.J.; Mosquera J.-M.; Montgomery B.; Taplin M.-E.; Pritchard C.C.; Attard G.; et al. Integrative Clinical Genomics of Advanced Prostate Cancer. Cell 2015, 161, 1215–1228, doi:10.1016/j.cell.2015.05.001. - DOI - PMC - PubMed
    1. Liu C.; Kelnar K.; Liu B.; Chen X.; Calhoun-Davis T.; Li H.; Patrawala L.; Yan H.; Jeter C.; Honorio S.; et al. The microRNA miR-34a Inhibits Prostate Cancer Stem Cells and Metastasis by Directly Repressing CD44. Nat. Med. 2011, 17, 211–215, doi:10.1038/nm.2284. - DOI - PMC - PubMed
    1. Al Salhi Y.; Sequi M.B.; Valenzi F.M.; Fuschi A.; Martoccia A.; Suraci P.P.; Carbone A.; Tema G.; Lombardo R.; Cicione A.; et al. Cancer Stem Cells and Prostate Cancer: A Narrative Review. Int. J. Mol. Sci. 2023, 24, 7746, doi:10.3390/ijms24097746. - DOI - PMC - PubMed

Publication types