

Assessment of corneal epithelial thickness mapping by spectral-domain optical coherence tomography
- PMID: 39399116
- PMCID: PMC11468417
- DOI: 10.3389/fmed.2024.1459636
Assessment of corneal epithelial thickness mapping by spectral-domain optical coherence tomography
Abstract
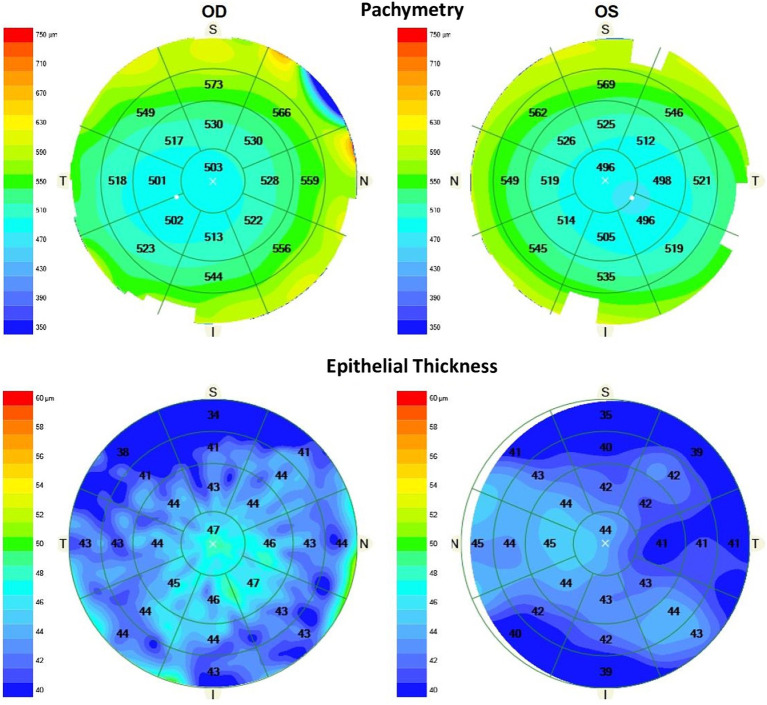
Background: To assess corneal epithelial-thickness (ET) mapping resulting from spectral-domain-optical-coherence-tomography (SD-OCT) by analysing its repeatability and reproducibility and its utility for screening corneal-refractive-surgery (CRS) candidates.
Methods: ET was measured in 25-sectors by two-operators. Intra-subject-standard-deviation, coefficient-of-repeatability (CoR) and coefficient-of-variability (CoV) were calculated to evaluate repeatability. Reproducibility was evaluated using a Bland-Altman analysis. Scheimpflug-tomography, refraction, visual acuity, and patient history were used to make a decision on eligibility for CRS. After this decision, the surgeon was shown the patient's ET map and was asked to reconsider his analysis. The percentage of screenings that changed after evaluating the ET maps was determined.
Results: Forty-three eyes with normal corneas (CRS-group) and 21 eyes not suitable for CRS (non-CRS-group) were studied. For the CRS-group, CoR ranged from 2.03 (central) to 19.73 μm (outer-inferonasal), with the central-sector showing the highest repeatability (CoV: 1.53-1.80%). For the non-CRS-group, CoR ranged from 3.82 (central-middle-superonasal) to 13.42 μm (middle-inferotemporal), with the inner-superonasal-sector showing the highest repeatability (CoV: 2.86-4.46%). There was no statistically significant difference between operators (p > 0.01). In the CRS-group, the outcomes showed a narrow 95% limits-of-agreement (LoA) for the central-and inner-nasal-sectors (about 4 μm), and wider for the inner-superior, outer-superotemporal and outer-inferonasal (about 10-14 μm). In the non-CRS-group, they were for the outer superonasal (about 4 μm), and for the middle-inferotemporal and outer-temporal (about 10 μm), respectively. Candidacy for CRS changed in 7.82% of patients after evaluation of the ET maps, with all of them screened-out.
Conclusion: The SD-OCT provided repeatable and reproducible corneal ET measurements and may alter candidacy for CRS.
Clinical trial registration: German Clinical Trials Register: https://drks.de/search/en/trial/DRKS00032797, identifier: DRKS00032797.
Keywords: cornea; epithelial thickness; optical coherence tomography; repeatability; reproducibility; spectral domain.
Copyright © 2024 Tañá-Rivero, Orts-Vila, Tañá-Sanz, Ramos-Alzamora and Montés-Micó.
Conflict of interest statement
The authors declare that the research was conducted in the absence of any commercial or financial relationships that could be construed as a potential conflict of interest.
Figures


References
-
- Temstet C, Sandali O, Bouheraoua N, Hamiche T, Galan A, El Sanharawi M, et al. . Corneal epithelial thickness mapping using Fourier-domain optical coherence tomography for detection of form fruste keratoconus. J Cataract Refract Surg. (2015) 41:812–20. doi: 10.1016/j.jcrs.2014.06.043, PMID: - DOI - PubMed
LinkOut - more resources
Full Text Sources
Research Materials