. 2024 Sep 27:15:1409149.
doi: 10.3389/fimmu.2024.1409149. eCollection 2024.

Role of disulfidptosis in colorectal adenocarcinoma: implications for prognosis and immunity

Affiliations

Role of disulfidptosis in colorectal adenocarcinoma: implications for prognosis and immunity

Ruanruan Yang et al. Front Immunol. .

Abstract

Background: Recent research has found a new way of cell death: disulfidptosis. Under glucose starvation, abnormal accumulation of disulfide molecules such as Cystine in Solute Carrier Family 7 Member 11 (SLC7A11) overexpression cells induced disulfide stress to trigger cell death. The research on disulfidptosis is still in its early stages, and its role in the occurrence and development of colorectal malignancies is still unclear.

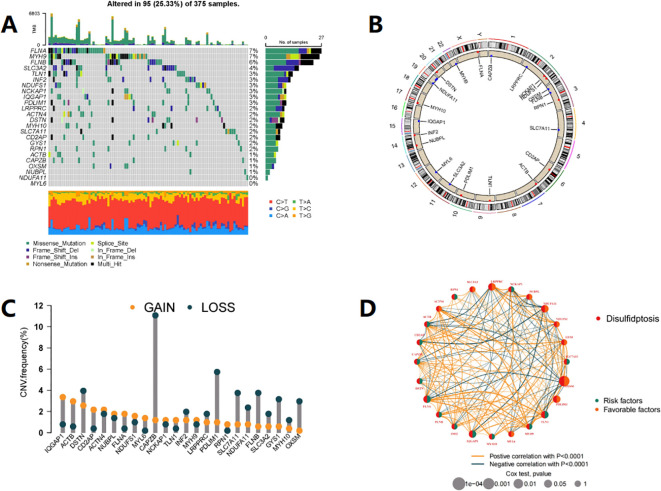
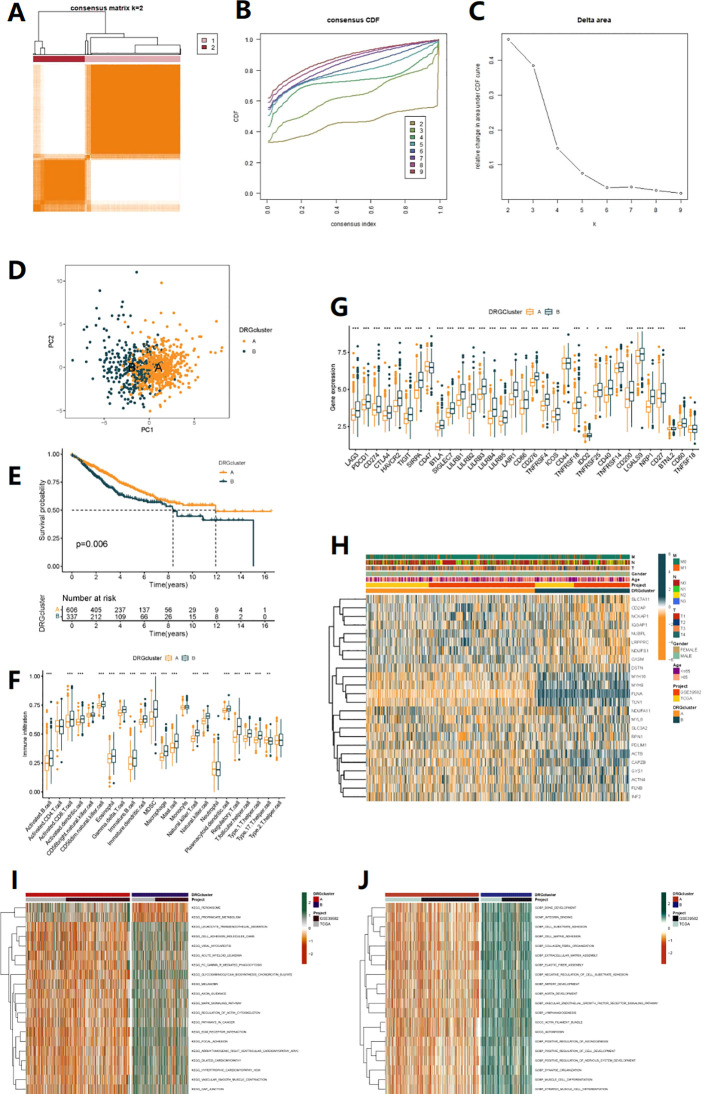
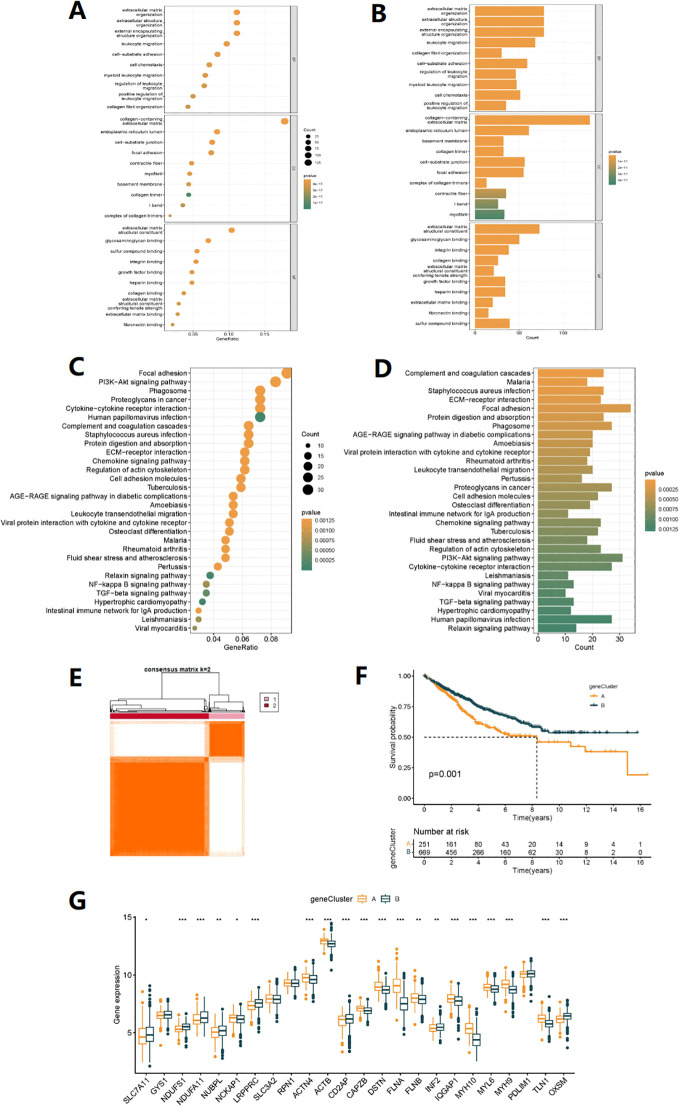
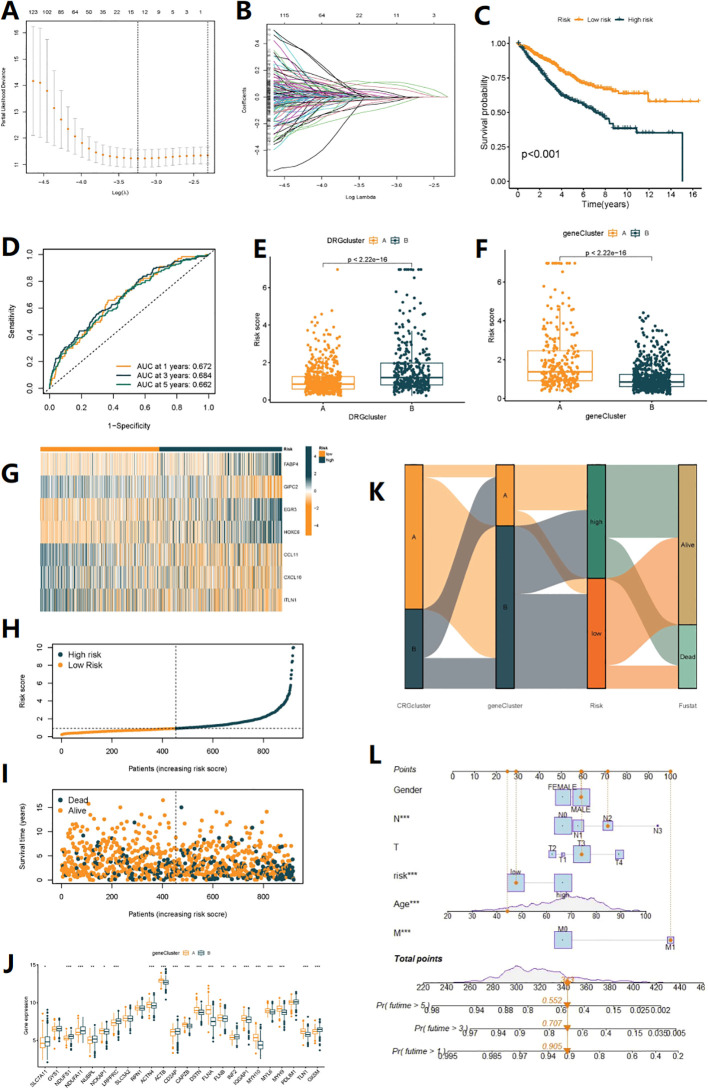
Method: In this study, we employed bioinformatics methods to analyze the expression and mutation characteristics of disulfidptosis-related genes (DRGs) in colorectal cancer. Consensus clustering analysis was used to identify molecular subtypes of Colorectal Adenocarcinoma (COAD) associated with disulfidptosis. The biological behaviors between subtypes were analyzed to explore the impact of disulfidptosis on the tumor microenvironment. Constructing and validating a prognostic risk model for COAD using diverse data. The influence of key genes on prognosis was evaluated through SHapley Additive exPlanations (SHAP) analysis, and the predictive capability of the model was assessed using Overall Survival analysis, Area Under Curve and risk curves. The immunological status of different patients and the prediction of drug treatment response were determined through immune cell infiltration, TMB, MSI status, and drug sensitivity analysis. Single-cell analysis was employed to explore the expression of genes at the cellular level, and finally validated the expression of key genes in clinical samples.

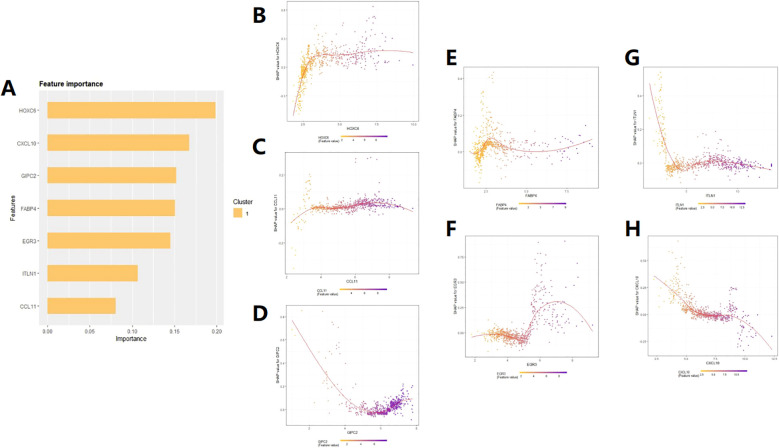
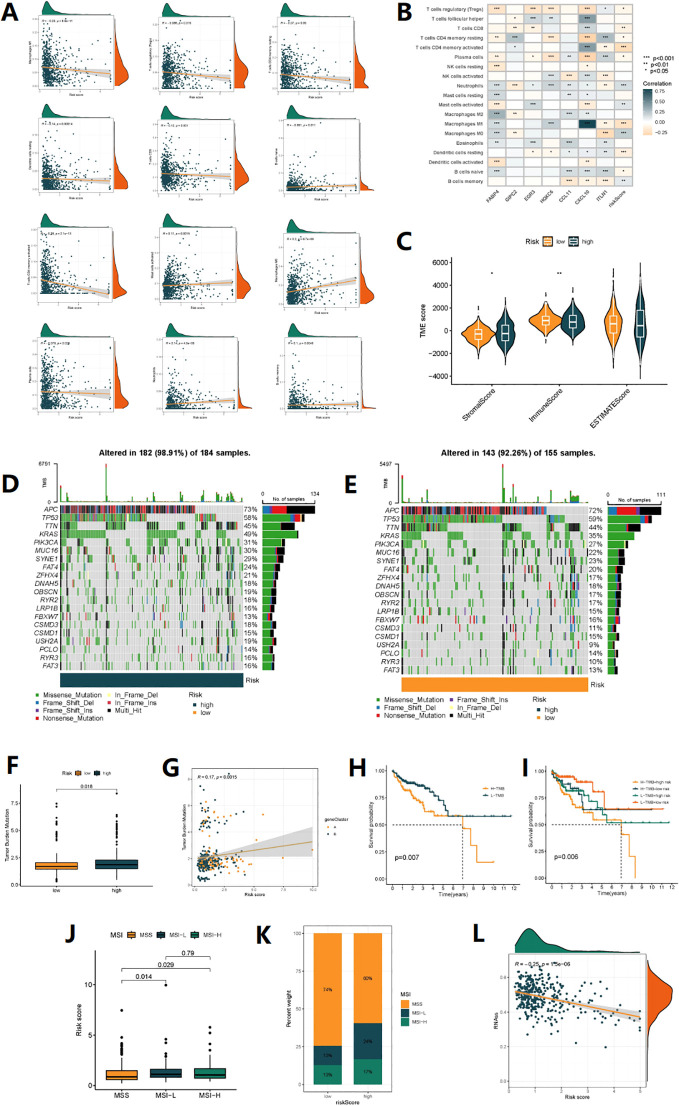
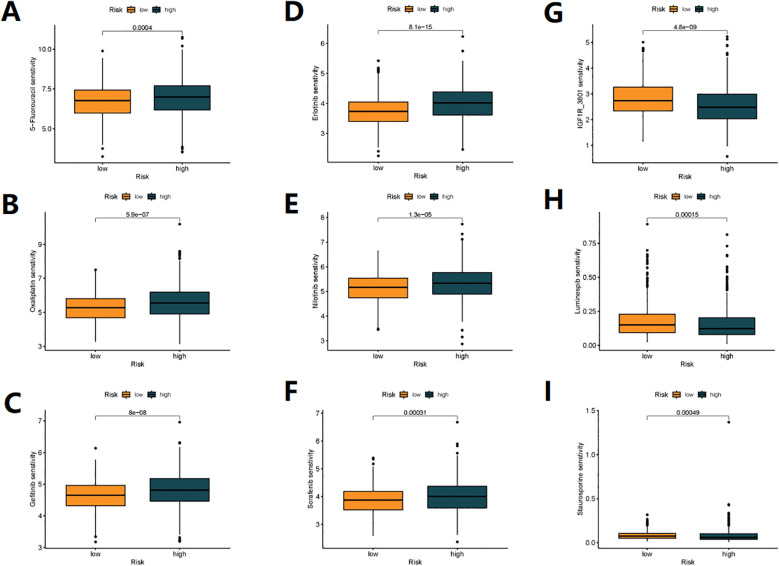
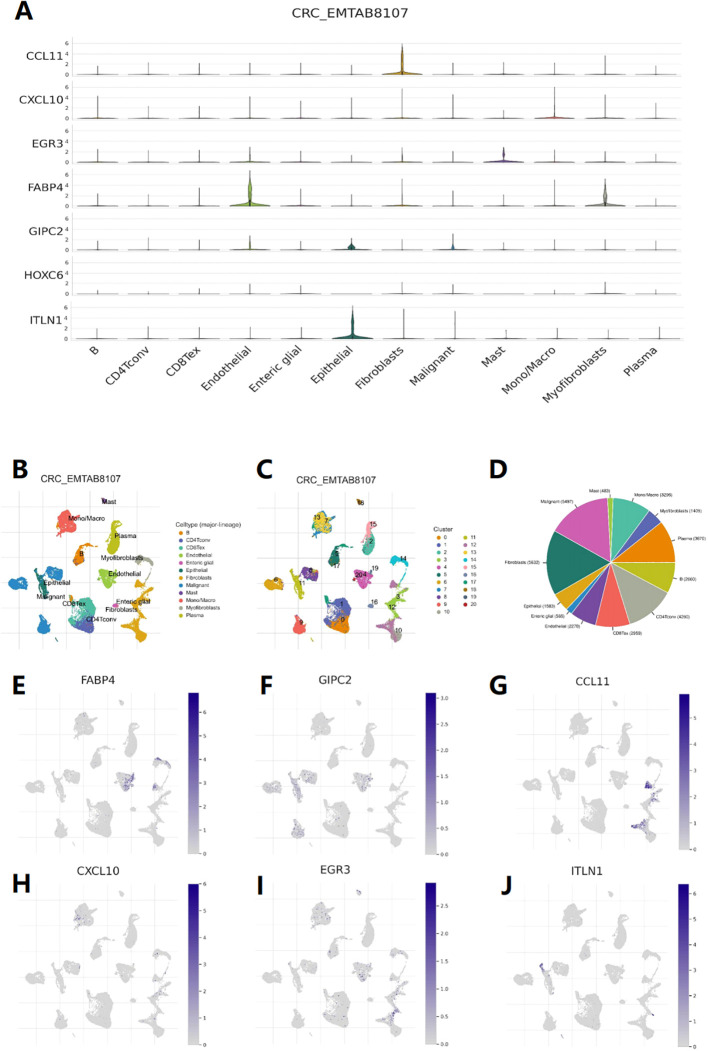
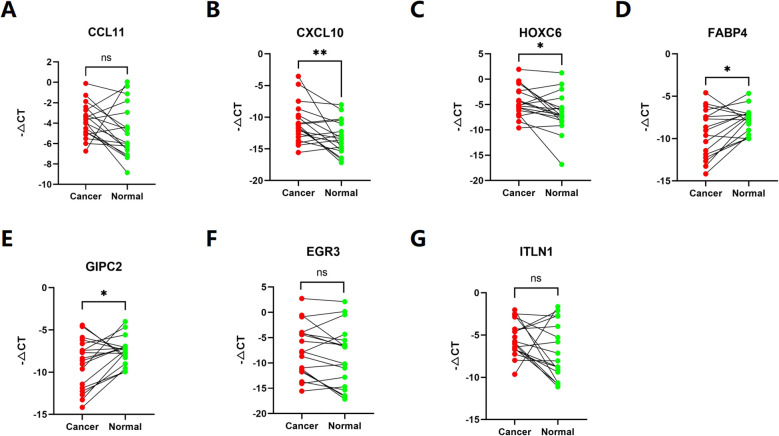
Result: By integrating the public data from two platforms, we identified 2 colorectal cancer subtypes related to DRGs. Ultimately, we established a prognosis risk model for COAD using 7 genes (FABA4+GIPC2+EGR3+HOXC6+CCL11+CXCL10+ITLN1). SHAP analysis can further explained the positive or negative impact of gene expression on prognosis. By dividing patients into high-risk and low-risk groups, we found that patients in the high-risk group had poorer prognosis, higher TMB, and a higher proportion of MSI-H and MSI-L statuses. We also predicted that drugs such as 5-Fluorouracil, Oxaliplatin, Gefitinib, and Sorafenib would be more effective in low-risk patients, while drugs like Luminesib and Staurosporine would be more effective in high-risk patients. Single-cell analysis revealed that these 7 genes not only differ at the level of immune cells but also in epithelial cells, fibroblasts, and myofibroblasts, among other cell types. Finally, the expression of these key genes was verified in clinical samples, with consistent results.

Conclusions: Our research findings provide evidence for the role of disulfidptosis in COAD and offer new insights for personalized and precise treatment of COAD.

Keywords: classification; colorectal cancer; disulfidptosis; drug sensitivity; prognosis.


Conflict of interest statement

The authors declare that the research was conducted in the absence of any commercial or financial relationships that could be construed as a potential conflict of interest.

Figures

Figure 1
Figure 1
Expression and mutation profile of DRG in COAD. (A) Mutation frequency of 24 DRGs in the TCGA-COAD cohort of 375 patients. (B) The locations of CNV alterations in DRGs across 23 chromosomes, The red dots represent gain, while the blue dots represent loss. (C) The DRGs in TCGA-COAD chohrt show instances of gene copy number gain and gene copy number loss. (D) Interactions among DRGs in COAD. Each node represents a gene, the size of the node corresponds to the significance level (p-value), indicating the strength of the association between the gene and prognosis. The orange and green connecting lines represent positive and negative interactions between genes, respectively.
Figure 2
Figure 2
Clinicopathological and biological characteristics associated with two subtypes of DRG identified by consensus clustering analysis. (A) Unsupervised clustering of disulfidptosis-related genes and Consensus matrix heatmaps for k =2. (B) Cumulative Distribution Function (CDF) from k=2 to 9. (C) relative change in area under CDF curve. (D) PCA analysis. (E) Kaplan-Meier curve shows different overall survival (OS) between the two DRG subtypes. (F) Bundance of 23 infiltrating immune cells in the two DRG subtypes (*p< 0.05, **p< 0.01, ***p< 0.001).(G) Differential expression analysis of immune checkpoint genes between two subtypes. (H) Heatmap of clinical pathological features and expression of 24 DRGs in TCGA-COAD, GSE39582 cohorts. (I, J) GO and KEGG enrichment analysis between two subtypes, with orange indicating activation of related pathways and green indicating inhibition of related pathways.
Figure 3
Figure 3
Gene subtype analysis based on DEGs. (A, B) GO enrichment analyses of DEGs among two DRG subtypes. (C, D) KEGG enrichment analyses of DEGs among two DRG subtypes. (E) The consensus clustering algorithm (k = 2) was used to divide all samples in TCGA-COAD and GSE35982 cohorts into two DRG gene subtypes. (F) Kaplan-Meier survival analysis of two gene subtypes. (G) Differences in the expression of 24 DRGs between two gene subtypes (*p< 0.05, **p< 0.01, ***p< 0.001).
Figure 4
Figure 4
Construction of disulfidptosis-related prognostic signature. (A, B) The LASSO path plot shows the feature selection process. (C) Kaplan-Meier curve shows different overall survival (OS) between high and low-risk score groups. (D) ROC curves to predict the sensitivity and specificity of 1-, 3- and 5-year survival according to the Risk score. (E, F) Differences in Risk score between the two DRG clusters and the two gene clusters. (G) Expression of 7 DEGs in the high and low-risk groups. (H, I) Ranked dot and scatter plots showing the Risk score distribution and patient survival status, respectly. (J) Expression of 24 DRGs in the high and low-risk groups. (K) Alluvial diagram of subtype distributions in groups with different DRG_scores and survival outcomes (*p< 0.05, **p< 0.01, ***p< 0.001). (L) Nomogram can integrate patients’ clinical features and risk scores to predict patient prognosis.
Figure 5
Figure 5
SHAP feature importance analysis. (A) Ranking of the impact of the 7 feature genes on patient prognosis. (B–H) Prediction of patient prognosis based on the relationship between SHAP values and the expression levels of the seven target genes.
Figure 6
Figure 6
TMB analysis and immune microenvironment analysis. (A) Correlations between Risk score and immune cell types. (B) The correlation between immune cell abundance and three genes in the risk model. (C) Comparison of StromalScores, ImmuneScores, and ESTIMATE Scores between high-risk and low-risk patients. (D, E) mutation status of all genes in high-risk and low-risk groups of patients is displayed separately. (F) Comparison of TMB levels between high-risk and low-risk patients. (G) The linear variation of tumor mutational burden (TMB) influenced by risk scores. (H) The KM curve graph indicates the impact of high and low TMB on patient survival. (I) The KM analysis assessed the differences in survival among patients with different TMB levels and risk scores. (J) The relationship between different MSI statuses and risk scores. (K) The proportion of different MSI statuses in the high-risk and low-risk groups. (L) The relationship between Stemness Scores and risk score.
Figure 7
Figure 7
(A–I) Relationships between DRG_score and Drug susceptibility.
Figure 8
Figure 8
Single-cell level analysis. (A) Violin diagram shows the distribution of 7 feature genes expression in different cells. (B) Single-cell type map of major-lineage. (C) Single-cell cluster map. (D) Sunburst plot for single-cell classification. (E-J) The cell type map shows the expression of 7 feature genes at different single-cell levels.
Figure 9
Figure 9
(A–G) The expression of each gene in 15 pairs of clinical COAD tissues and adjacent normal tissues. (ns p>0,05, *p< 0.05, **p< 0.01).

References

    1. Bray F, Ferlay J, Soerjomataram I, Siegel R. Global cancer statistics 2018: GLOBOCAN estimates of incidence and mortality worldwide for 36 cancers in 185 countries. CA Cancer J Clin. (2018) 68:394–424. doi: 10.3322/caac.21492 - DOI - PubMed
    1. Munro MJ, Wickremesekera SK, Peng L, Tan ST, Itinteang T. Cancer stem cells in colorectal cancer: A review. J Clin Pathol. (2018) 71:110–6. doi: 10.1136/jclinpath-2017-204739 - DOI - PubMed
    1. Xi Y, Xu P. Global colorectal cancer burden in 2020 and projections to 2040. Transl Oncol. (2021) 14:101174. doi: 10.1016/j.tranon.2021.101174 - DOI - PMC - PubMed
    1. Miller KD, Nogueira L, Mariotto AB, Rowland JH, Yabroff KR, Alfano CM. Cancer treatment and survivorship statistics. CA Cancer J Clin. (2019) 69:363–85. doi: 10.3322/caac.21565 - DOI - PubMed
    1. Liu X, Nie L, Zhang Y, Yan Y, Wang C. Actin cytoskeleton vulnerability to disulfide stress mediates disulfidptosis. Nat Cell Biol. (2023) 25:404–14. doi: 10.1038/s41556-023-01091-2 - DOI - PMC - PubMed

MeSH terms

Substances

LinkOut - more resources