Measuring Piezo1 and Actin Polarity in Chemokine-Stimulated Jurkat Cells During Live-Cell Imaging
- PMID: 39399591
- PMCID: PMC11470381
- DOI: 10.21769/BioProtoc.5079
Measuring Piezo1 and Actin Polarity in Chemokine-Stimulated Jurkat Cells During Live-Cell Imaging
Abstract
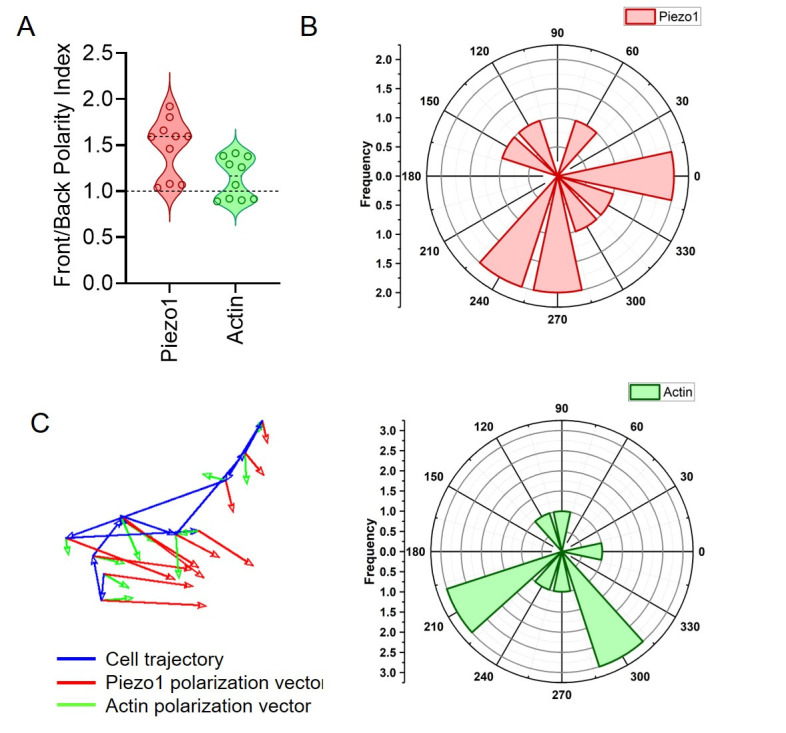
The process of T-lymphocyte migration involves a complex interplay of chemical and mechanical signals. Mechanotransduction mechanisms in T lymphocytes enable them to efficiently navigate through diverse architectural and topographical features of the dynamic tissue macro- and micro-niches encountered during immune responses. Piezo1 mechanosensors are crucial for driving optimal T-cell migration by driving actin-cytoskeletal remodeling. Chemokine-stimulated T lymphocytes demonstrate significant asymmetry or polarity of Piezo1 and actin along the cell axis. The establishment and maintenance of polarity in migrating cells are paramount for facilitating coordinated and directional movements along gradients of chemokine signals. Live-cell imaging techniques are widely employed to study the trajectories of migrating cells. Our approach expands upon current methodologies by not only tracking migrating cells but also imaging fluorescently labeled cellular components. Specifically, our method enables measurement of protein enrichment in the front and rear halves of the moving cell by analyzing the temporal direction of cell trajectories, subsequently bisecting the cell into front-back halves, and measuring the intensities of the fluorescent signals in each cell half at each time frame. Our protocol also facilitates the quantification of the angular distribution of fluorescent signals, enabling visualization of the spatial distribution of signals relative to the direction of cell migration. The protocol describes the examination of polarity in chemokine-treated Jurkat cells transfected with Piezo1-mCherry and actin-GFP constructs. This approach can be extended to live-cell imaging and polarity assessment of other fluorescently labeled proteins. Key features • This experimental protocol allows real-time imaging of Jurkat cells expressing two fluorescent proteins (Piezo1 mCherry and actin-GFP). • Measures cell polarity by examining spatial enrichment of Piezo1 and actin proteins within the front and rear halves of a moving Jurkat cell. • The protocol enables analysis of cell polarity in 2D tracks of moving cells. • Polarity analysis includes measuring fluorescent signal intensities in front-rear halves of a moving cell and calculation of signal polarization angles relative to the cell trajectory.
Keywords: Actin-GFP imaging; Angular distribution; Cell polarity; Jurkat cell line; Piezo1 mCherry; Time-lapse confocal imaging.
©Copyright : © 2024 The Authors; This is an open access article under the CC BY-NC license.
Conflict of interest statement
Competing interestsThe authors declare no competing financial interests.
Figures
References
-
- Moreau H. D., Piel M., Voituriez R. and Lennon-Duménil A. M.(2018). Integrating Physical and Molecular Insights on Immune Cell Migration. Trends Immunol. 39(8): 632-643. - PubMed
-
- Kameritsch P. and Renkawitz J.(2020). Principles of Leukocyte Migration Strategies. Trends Cell Biol. 30(10): 818-832. - PubMed
LinkOut - more resources
Full Text Sources