

This is a preprint.
MammOnc-DB, an integrative breast cancer data analysis platform for target discovery
- PMID: 39399665
- PMCID: PMC11469468
- DOI: 10.21203/rs.3.rs-4926362/v1
MammOnc-DB, an integrative breast cancer data analysis platform for target discovery
Update in
-
MammOnc-DB, an integrative breast cancer data analysis platform for target discovery.NPJ Breast Cancer. 2025 Apr 18;11(1):35. doi: 10.1038/s41523-025-00750-x. NPJ Breast Cancer. 2025. PMID: 40251157 Free PMC article.
Abstract
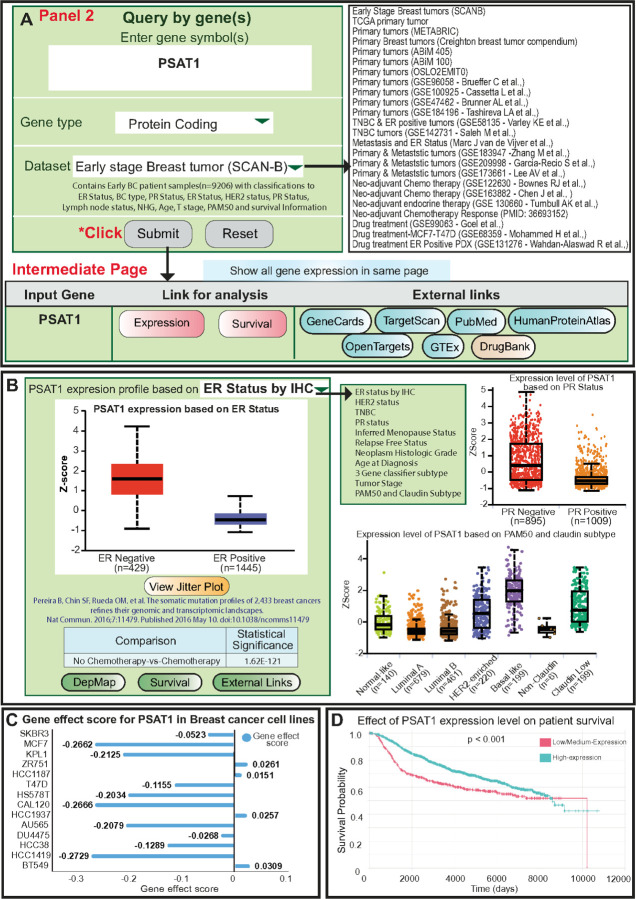
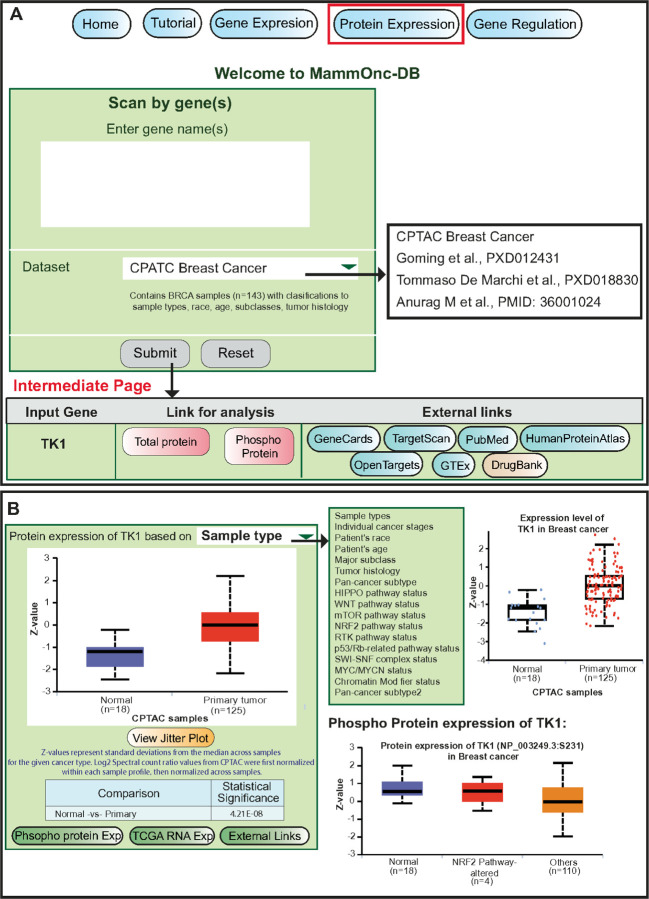
Breast cancer (BCa) is one of the most common malignancies among women worldwide. It is a complex disease that is characterized by morphological and molecular heterogeneity. In the early stages of the disease, most BCa cases are treatable, particularly hormone receptor-positive and HER2-positive tumors. Unfortunately, triple-negative BCa and metastases to distant organs are largely untreatable with current medical interventions. Recent advances in sequencing and proteomic technologies have improved our understanding of the molecular changes that occur during breast cancer initiation and progression. In this era of precision medicine, researchers and clinicians aim to identify subclass-specific BCa biomarkers and develop new targets and drugs to guide treatment. Although vast amounts of omics data including single cell sequencing data, can be accessed through public repositories, there is a lack of user-friendly platforms that integrate information from multiple studies. Thus, to meet the need for a simple yet effective and integrative BCa tool for multi-omics data analysis and visualization, we developed a comprehensive BCa data analysis platform called MammOnc-DB (http://resource.path.uab.edu/MammOnc-Home.html), comprising data from more than 20,000 BCa samples. MammOnc-DB was developed to provide a unique resource for hypothesis generation and testing, as well as for the discovery of biomarkers and therapeutic targets. The platform also provides pre- and post-treatment data, which can help users identify treatment resistance markers and patient groups that may benefit from combination therapy.
Conflict of interest statement
7.Competing interests: All authors declare no financial or non-financial competing interests.
Figures


References
-
- Siegel R. L., Giaquinto A. N. & Jemal A. Cancer statistics, 2024. CA Cancer J Clin 74, 12–49 (2024). https://doi.org: 10.3322/caac.21820 - DOI - PubMed
-
- Łukasiewicz S. et al. Breast Cancer-Epidemiology, Risk Factors, Classification, Prognostic Markers, and Current Treatment Strategies-An Updated Review. Cancers (Basel) 13 (2021). https://doi.org: 10.3390/cancers13174287 - DOI - PMC - PubMed
-
- Harbeck N. et al. Breast cancer. Nat Rev Dis Primers 5, 66 (2019). https://doi.org: 10.1038/s41572-019-0111-2 - DOI - PubMed
-
- Loibl S., Poortmans P., Morrow M., Denkert C. & Curigliano G. Breast cancer. Lancet 397, 1750–1769 (2021). https://doi.org: 10.1016/s0140-6736(20)32381-3 - DOI - PubMed
-
- Sun Y. S. et al. Risk Factors and Preventions of Breast Cancer. Int J Biol Sci 13, 1387–1397 (2017). https://doi.org: 10.7150/ijbs.21635 - DOI - PMC - PubMed
Publication types
Grants and funding
LinkOut - more resources
Full Text Sources
Research Materials
Miscellaneous
