. 2025 Jan;62(1):e14708.
doi: 10.1111/psyp.14708. Epub 2024 Oct 14.

Revealing the different levels of action monitoring in visuomotor transformation task: Evidence from decomposition of cortical potentials

Affiliations

Revealing the different levels of action monitoring in visuomotor transformation task: Evidence from decomposition of cortical potentials

Nikolay Syrov et al. Psychophysiology. 2025 Jan.

Abstract

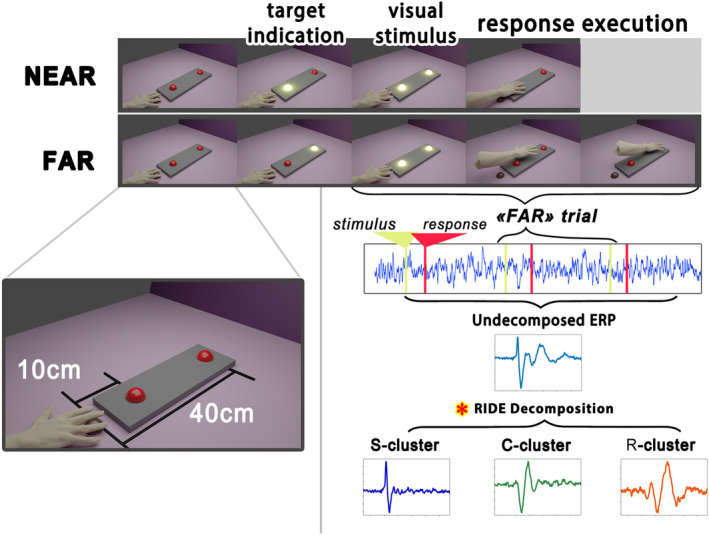
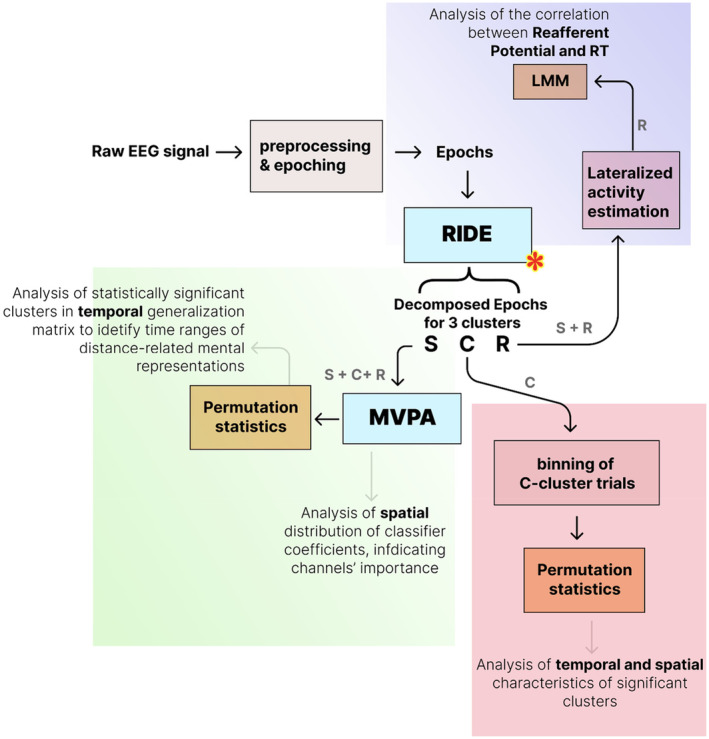
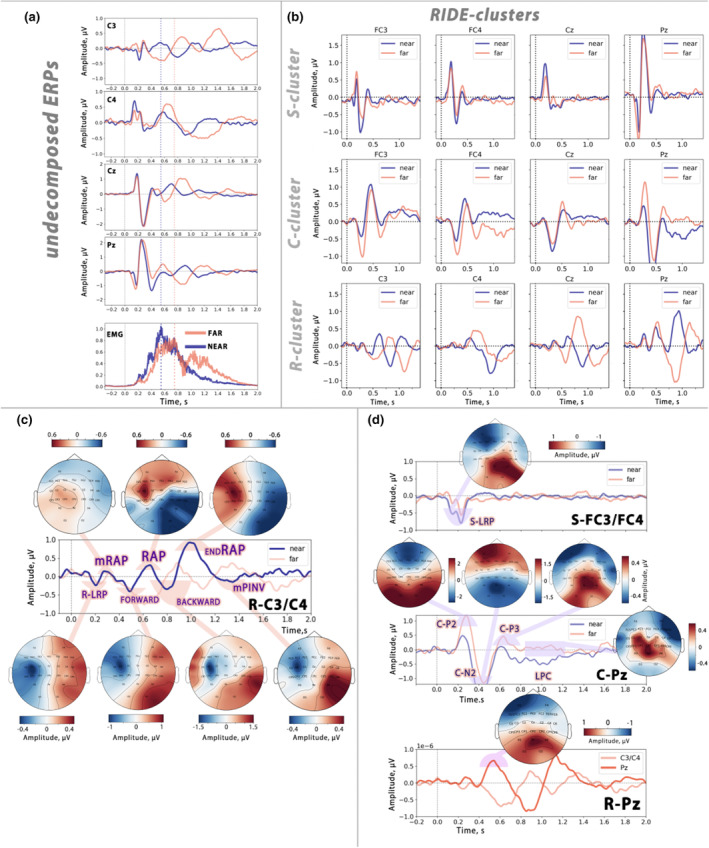
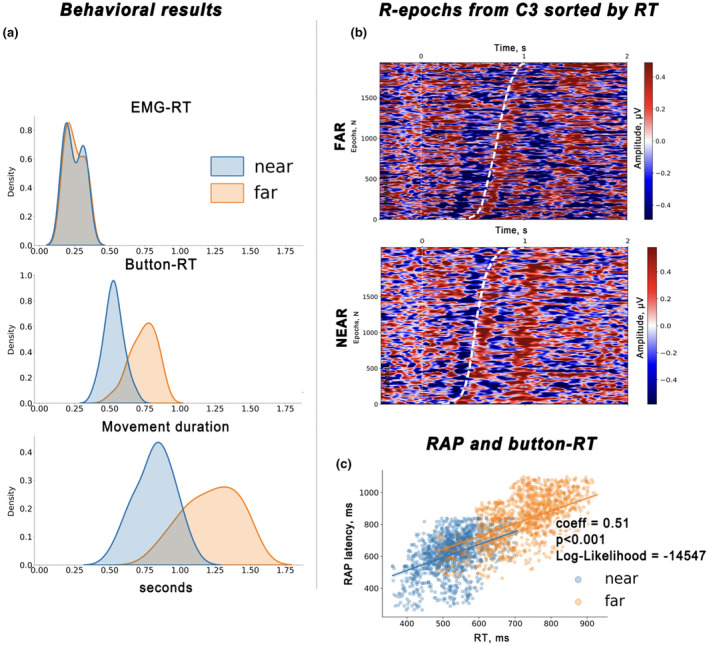
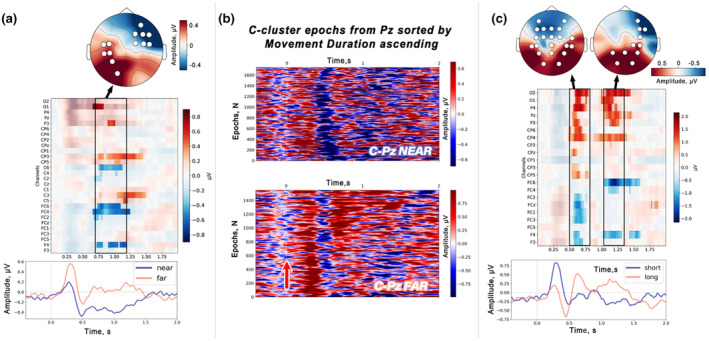
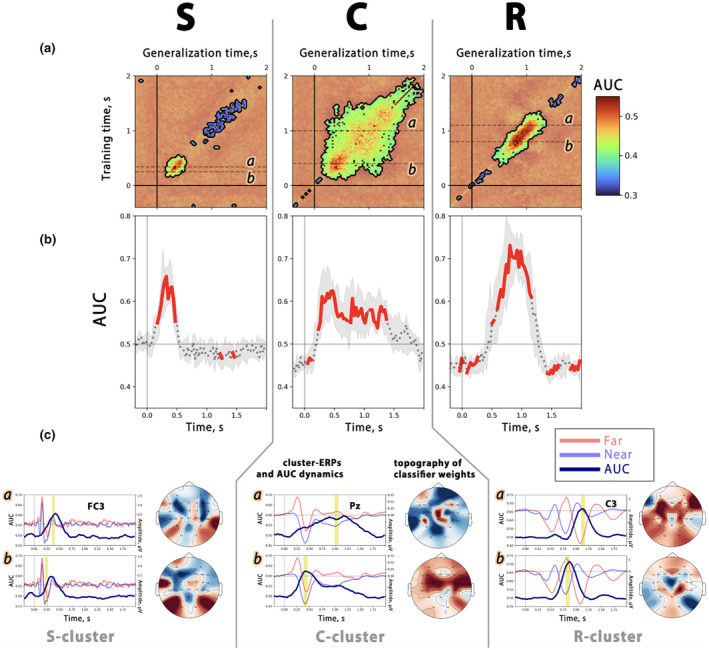
This study investigates the cortical correlates of motor response control and monitoring, using the Theory of Event Coding (TEC) as a framework to investigate signals related to low-level sensory processing of motor reafference and high-level response monitoring, including verification of response outcomes with the internal model. We used a visuomotor paradigm with two targets at different distances from the participant. For the recorded movement-related cortical potentials (MRCPs), we analyzed their different components and assessed the movement phases during which they are active. Residual iteration decomposition (RIDE) and multivariate pattern analysis (MVPA) were used for this analysis. Using RIDE, we separated MRCPs into signals related to different parallel processes of visuomotor transformation: stimulus processing (S-cluster), motor response preparation and execution (R-cluster), and intermediate processes (C-cluster). We revealed sequential activation in the R-cluster, with execution-related negative components and positive contralateral peaks reflecting reafference processing. We also identified the motor post-imperative negative variation within the R-cluster, highlighting the response outcome evaluation process included in the action file. Our findings extend the understanding of C-cluster signals, typically associated with stimulus-response mapping, by demonstrating C-activation from the preparatory stages through to response termination, highlighting its participation in action monitoring. In addition, we highlighted the ability of MVPA to identify movement-related attribute encoding: where statistical analysis showed independence of stimulus processing activity from movement distance, MVPA revealed distance-related differences in the S-cluster within a time window aligned with the lateralized readiness potential (LRP). This highlights the importance of integrating RIDE and MVPA to uncover the intricate neural dynamics of motor control, sensory integration, and response monitoring.

Keywords: P3; multivariate pattern analysis; reafferent potential; residue iteration decomposition; response monitoring; theory of event coding; visuomotor transformation.


Conflict of interest statement

The authors have no conflicts of interest to declare that are relevant to the content of this article.

Figures

FIGURE 1
FIGURE 1
The experimental design and data processing pipeline. Two linearly distanced target buttons were to be reached and pressed in response to flashlights (far and near). The participant's right hand rested on the start button from which each response was initiated and terminated. Each block of trials began with the identification of the target button, after which each flashlight required reaching and pressing the target button. A total of 6 far and 6 near blocks of trials were performed, resulting in 180 responses per condition per subject. EEG signal recording was synchronized with the presentation of the visual stimuli and the button presses. Response times in each trial were used for EEG signal decomposition with the RIDE algorithm. Stimulus‐related (S), response‐related (R), and intermediate signals (C) were decomposed in separate clusters. An example of decomposed MRCP and three clusters obtained with RIDE are shown in the lower right panel. The red asterisk connects the RIDE decomposition scheme with the data processin g pipeline shown in Figure 2.
FIGURE 2
FIGURE 2
The conceptual scheme of data processing and analysis. The red asterisk shows the place of the RIDE decomposition within a processing pipeline (see also Figure 1). Letters S, C, and R refer to RIDE clusters. The letters near the arrows indicate which cluster data was used in the corresponding analysis step.
FIGURE 3
FIGURE 3
Waveforms of movement‐related cortical potentials and scalp topography maps in far and near trials. (a) Undecomposed stimulus‐locked grand mean evoked potentials in different channels. Averaged RMS‐transformed EMG responses in far and near responses are shown below. (b) Waveforms of RIDE clusters in different channels for far and near trials. (c) Lateralized R‐cluster activity obtained by subtracting C4 signals from C3. Each motor response phase is represented by a sequence of negative and positive lateralized deflections. R‐LRP refers to the R‐cluster lateralized readiness potential, mRAP indicates lateralized activity derived from the RAP associated with muscle activation, forward and backward movements are characterized by slow negative contralateral waves, while RAP and endRAP indicate peaks associated with afferent processing during button press and response termination as the start button. Note that the late deflections for far and near trials are not synchronized. The scalp topography map for each peak response of the near condition is shown. (d) The top panel shows waveform and scalp topography of lateralized S‐cluster activity obtained by subtracting C4 signals from C3. S‐LRP refers to the lateralized S‐cluster readiness potential. The middle panel shows C‐cluster activity from the Pz channel. Fronto‐parietal peaks (C‐P2, C‐N2, and C‐P3) and the late positive complex are shown with their topomaps indicating their fronto‐parietal scalp topographic distribution. The bottom panels show R‐cluster activity from the Pz channel. R‐P3 potential is shown with its parietal scalp distribution.
FIGURE 4
FIGURE 4
Relationships between R‐cluster responses and response times. (a) Behavioral metrics that characterize motor performance for the group of subjects: EMG‐RT refers to the reaction time calculated from the rise of the EMG signal indicating the start of the movement; Button‐RT refers to the moment of pressing the target button (far or near); movement duration was obtained by subtracting EMG‐RT from Button‐RT in each trial. (b) Single‐trial R‐signals from channel C3 are plotted in ascending response time (RT) order, with a bold dashed white line marking the RT. Note the appearance of the RAP peak immediately after the button is pressed. (c) Graph shows the correlation between RAP peak latency and RT, where each point represents a single trial. The results of the LMM analysis are shown in the legend.
FIGURE 5
FIGURE 5
C‐cluster signal differences in far vs. near trials and motion duration effects. (a) Permutation statistical test results show far and near response differences within an LPC‐aligned interval. A color panel shows C‐cluster amplitudes across channels, with a mask highlighting where significant distance differences were found. The topography map shows the scalp distribution of signal amplitudes in this interval, with channels included in significant clusters highlighted. (b) Single‐trial C‐signals from the Pz channel for both conditions, ordered by increasing movement duration. The red arrow indicates the direction of movement duration increase. (c) Permutation test results show significant clusters discriminating short from long movements in the far condition. Temporal characteristics of the clusters indicate differences within the LPC activity interval, spatial characteristics indicate the fronto‐parietal channels included in the cluster (topographic maps are provided).
FIGURE 6
FIGURE 6
MVPA results. (a) Temporal generalization matrices separately for the RIDE decomposed C‐, R‐, and S‐clusters. The plots show how a classifier trained at specific points in time generalizes across the trial timeline. The performance of the classifier is shown on a scale, with diagonal lines indicating the effectiveness of training and testing at the same time. Masks highlight areas of statistically significant decoding (p < 0.01; 2‐sided cluster‐based permutation). Notably, the S‐cluster shows brief diagonal activation between 150 and 550 ms, the C‐cluster shows extended diagonal and off‐diagonal activity from 100 ms to the end of the trial, and the R‐cluster shows focused diagonal activation from 500 to 1200 ms. (b) Classification performance between far and near trials, represented as AUC separately for the RIDE‐decomposed C‐, R‐, and S‐clusters (diagonal values from the presentation of the above temporal generalization matrices). Time 0 indicates the presentation of the visual stimulus. Bold red lines indicate significant time windows (p < 0.01; 2‐sided cluster‐based permutation). (c) Decoding as a function of time. These curves represent the AUC values obtained from classifiers trained at specific time points (labeled a and b) and tested over the entire epoch. The topographical maps show the classification coefficients, which indicate the weight of each channel. Topographic maps show channels with the most significant impact on classification performance. Yellow vertical areas indicate time intervals corresponding to the topographic maps.

Similar articles

References

    1. Bender, S. , Becker, D. , Oelkers‐Ax, R. , & Weisbrod, M. (2006). Cortical motor areas are activated early in a characteristic sequence during post‐movement processing. NeuroImage, 32(1), 333–351. 10.1016/j.neuroimage.2006.03.009 - DOI - PubMed
    1. Bender, S. , Resch, F. , Klein, C. , Renner, T. , Fallgatter, A. J. , Weisbrod, M. , & Romanos, M. (2012). Influence of stimulant medication and response speed on lateralization of movement‐related potentials in attention‐deficit/hyperactivity disorder. PLoS One, 7(6), e39012. 10.1371/journal.pone.0039012 - DOI - PMC - PubMed
    1. Berchicci, M. , Spinelli, D. , & Di Russo, F. (2016). New insights into old waves. Matching stimulus‐and response‐locked ERPs on the same time‐window. Biological Psychology, 117, 202–215. 10.1016/j.biopsycho.2016.04.007 - DOI - PubMed
    1. Blakemore, S. J. , & Sirigu, A. (2003). Action prediction in the cerebellum and in the parietal lobe. Experimental Brain Research, 153, 239–245. 10.1007/s00221-003-1597-z - DOI - PubMed
    1. Bötzel, K. , Ecker, C. , & Schulze, S. (1997). Topography and dipole of reafferent electrical brain activity following the Bereitschaftpotential. Experimental Brain Research, 114, 352–361. 10.1007/PL00005643 - DOI - PubMed

LinkOut - more resources