Review
. 2025 Sep-Oct;44(5):808-829.
doi: 10.1002/mas.21910. Epub 2024 Oct 13.

Ion Source Complementarity for Characterization of Complex Organic Mixtures Using Fourier Transform Mass Spectrometry: A Review

Affiliations
Review

Ion Source Complementarity for Characterization of Complex Organic Mixtures Using Fourier Transform Mass Spectrometry: A Review

Charlotte Mase et al. Mass Spectrom Rev. 2025 Sep-Oct.

Abstract

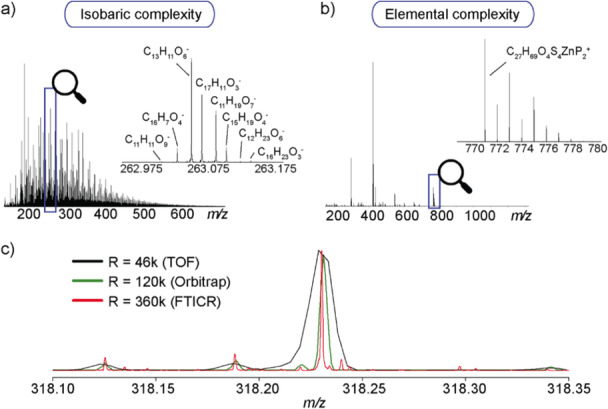
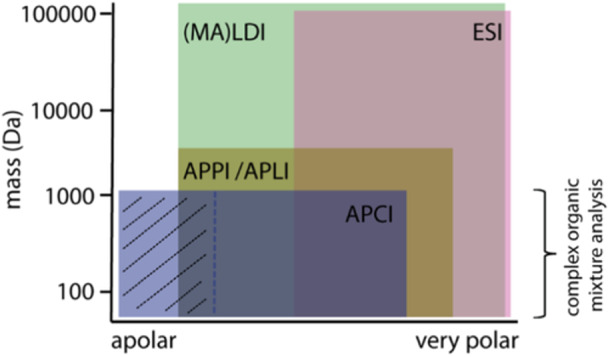
Complex organic mixtures are found in many areas of research, such as energy, environment, health, planetology, and cultural heritage, to name but a few. However, due to their complex chemical composition, which holds an extensive potential of information at the molecular level, their molecular characterization is challenging. In mass spectrometry, the ionization step is the key step, as it determines which species will be detected. This review presents an overview of the main ionization sources employed to characterize these kinds of samples in Fourier transform mass spectrometry (FT-MS), namely electrospray (ESI), atmospheric pressure photoionization (APPI), atmospheric pressure chemical ionization (APCI), atmospheric pressure laser ionization (APLI), and (matrix-assisted) laser desorption ionization ((MA)LDI), and their complementarity in the characterization of complex organic mixtures. First, the ionization techniques are examined in the common direct introduction (DI) usage. Second, these approaches are discussed in the context of coupling chromatographic techniques such as gas chromatography, liquid chromatography, and supercritical fluid chromatography.

Keywords: complex organic mixtures; hyphenation; ionization sources; mass spectrometry; ultrahigh‐resolution.


Figures

Figure 1
Figure 1
Select most prevalent research fields involving complex organic mixtures analysis. [Color figure can be viewed at wileyonlinelibrary.com]
Figure 2
Figure 2
Comparison between (a) isobaric and (b) elemental complexity found in complex organic mixtures. (c) Comparison of performance between a time‐of‐flight (TOF), Orbitrap Exploris 120, and FT‐ICR 12T mass analyzer with the zoom of a nominal mass justifying the use of FT‐MS analyzer for the molecular characterization of complex organic mixtures. Note that results showed correspond to internal results obtained from a pyrolysis pine oil, and lubricant additive samples. [Color figure can be viewed at wileyonlinelibrary.com]
Figure 3
Figure 3
Schematic description of the five main atmospheric pressure ionization sources used for the molecular characterization of complex organic mixtures. (a) Electrospray ionization (ESI), (b) atmospheric pressure chemical ionization (APCI), (c) atmospheric pressure photoionization (APPI), (d) atmospheric pressure laser ionization (APLI), and (e) laser desorption ionization (LDI). [Color figure can be viewed at wileyonlinelibrary.com]
Figure 4
Figure 4
Selectivity of the five main ionization sources used for the chemical description of the complex organic mixture in the function of the polarity and the molecular weight of analytes. The dotted line corresponds to the boundary between the area covered by conventional APCI and the area covered by APCI when hydrocarbons are used as dopants (indicated by the striped area). APCI, atmospheric pressure chemical ionization; APLI, atmospheric pressure laser ionization; APPI, atmospheric pressure photoionization; ESI, electrospray ionization; (MA)LDI, (matrix‐assisted) laser desorption ionization. [Color figure can be viewed at wileyonlinelibrary.com]
Figure 5
Figure 5
On the left: mass spectra enlarged at m/z 470 obtained with ESI, H‐ESI, APCI, APPI, and APLI with assigned molecular formulas. Formulas, found in APLI, are highlighted with red color. On the right: DBE distribution of the individual compound classes using the same ionization conditions for the characterization of asphaltenes. The scale is the number of assigned molecules (Gaspar, Lababidi, et al. 2012). [Color figure can be viewed at wileyonlinelibrary.com]
Figure 6
Figure 6
DBE versus carbon number plots of N1, O1, O2, and CH class detected by ESI (+/−) and APPI (+) FT‐ICR MS for a refinery wastewater DOM showing the complementarity of the ionization sources. Bubble size indicative of the abundance. The supposed structures were proposed based on the molecular composition (note: the structures are just possible but not detected) (He et al. 2021). [Color figure can be viewed at wileyonlinelibrary.com]
Figure 7
Figure 7
Venn diagram achieved from data obtained in ESI and APPI‐FT‐ICR MS in both positive and negative ionization modes. The heteroatom class distributions and the corresponding weighted average values gathered in the tables are given for specific and common features (Hertzog, Naraoka, and Schmitt‐Kopplin 2019). [Color figure can be viewed at wileyonlinelibrary.com]
Figure 8
Figure 8
van Krevelen diagrams obtained with APCI, APPI, ESI, and LDI‐FT‐ICR‐MS in negative ion mode showing the complementarity of the ionization sources for the characterization of a scotch whisky (Kew et al. 2018). Each assignment from individual ionization modes was plotted with the size of the glyph representing the median abundance across four whisky samples. The color represents the mass of the peak. The number in the bottom right corner shows the number of unique formulas identified for each ionization source across four samples. [Color figure can be viewed at wileyonlinelibrary.com]
Figure 9
Figure 9
Comparison of class distribution based on the number of the main assigned compounds between EI high and low energy and APPI for the characterization of gas condensate by GC‐Orbitrap MS (Kondyli and Schrader 2019). [Color figure can be viewed at wileyonlinelibrary.com]
Figure 10
Figure 10
van Krevelen diagram obtained by ESI and APCI in both positive and negative ion modes in LC‐FT‐MS for the characterization of liquid−liquid fractions (AQ for aqueous and ORG for organic) of lignocellulosic‐based biomass (Zark, Christoffers, and Dittmar 2017). [Color figure can be viewed at wileyonlinelibrary.com]
Figure 11
Figure 11
Class distribution based on the number of assigned formulas using ESI, APPI, APCI, and APLI sources obtained for the two peaks separated in LC‐FT‐ICR MS on a deasphalted crude oil (Lababidi and Schrader 2014). [Color figure can be viewed at wileyonlinelibrary.com]

References

    1. Abdul Jameel, A. G. , Khateeb A., Elbaz A., et al. 2019. “Characterization of Deasphalted Heavy Fuel Oil Using Appi (+) FT‐ICR Mass Spectrometry and NMR Spectroscopy.” Fuel 253: 950–963.
    1. Abou‐Dib, A. , Aubriet F., Hertzog J., Vernex‐Loset L., Schramm S., and Carré V.. 2022. “Next Challenges for the Comprehensive Molecular Characterization of Complex Organic Mixtures in the Field of Sustainable Energy.” Molecules 27, no. 24: 8889. - PMC - PubMed
    1. Aharoni, A. , Ric de Vos C. H., Verhoeven H. A., et al. 2002. “Nontargeted Metabolome Analysis by Use of Fourier Transform Ion Cyclotron Mass Spectrometry.” OMICS: A Journal of Integrative Biology 6, no. 3: 217–234. - PubMed
    1. Andrade, F. J. , Shelley J. T., Wetzel W. C., et al. 2008. “Atmospheric Pressure Chemical Ionization Source. 1. Ionization of Compounds in the Gas Phase.” Analytical Chemistry 80, no. 8: 2646–2653. - PubMed
    1. Ayala‐Cabrera, J. F. , Lipok C., Moyano E., Schmitz O. J., and Santos F. J.. 2021. “Atmospheric Pressure Ionization for Gas Chromatography‐High Resolution Mass Spectrometry Determination of Polychlorinated Naphthalenes in Marine Sediments.” Chemosphere 263: 127963. - PubMed

LinkOut - more resources