. 2024 Oct 14;11(1):85.
doi: 10.1186/s40658-024-00681-9.

Method for co-registration of high-resolution specimen PET-CT with histopathology to improve insight into radiotracer distributions

Affiliations

Method for co-registration of high-resolution specimen PET-CT with histopathology to improve insight into radiotracer distributions

Luna Maris et al. EJNMMI Phys. .

Abstract

Background: As the spatial resolution of positron emission tomography (PET) scanners improves, understanding of radiotracer distributions in tissues at high resolutions is important. Hence, we propose a method for co-registration of high-resolution ex vivo specimen PET images, combined with computed tomography (CT) images, and the corresponding specimen histopathology.

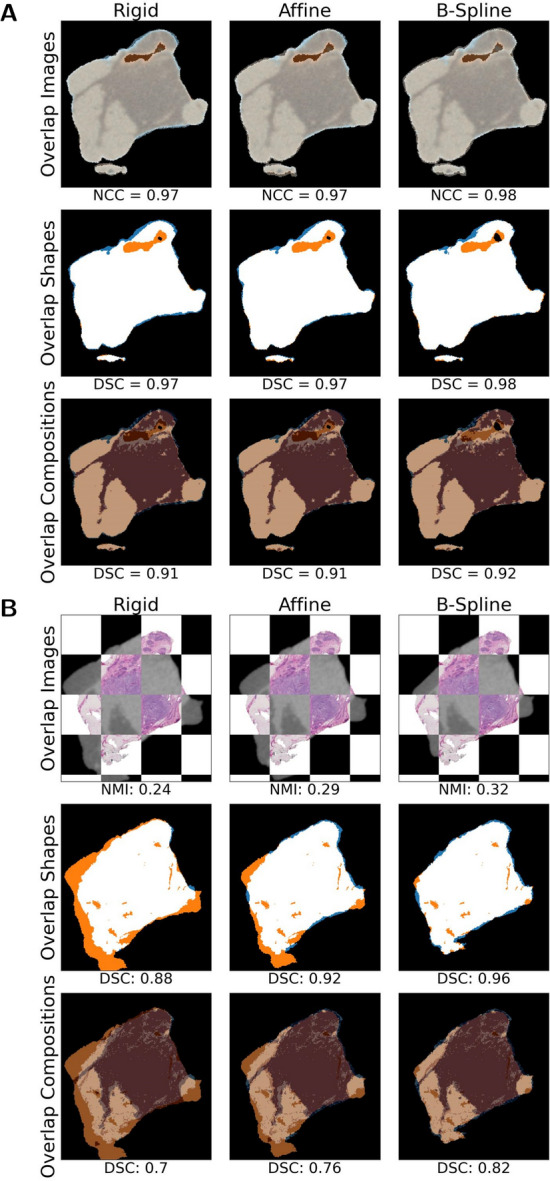
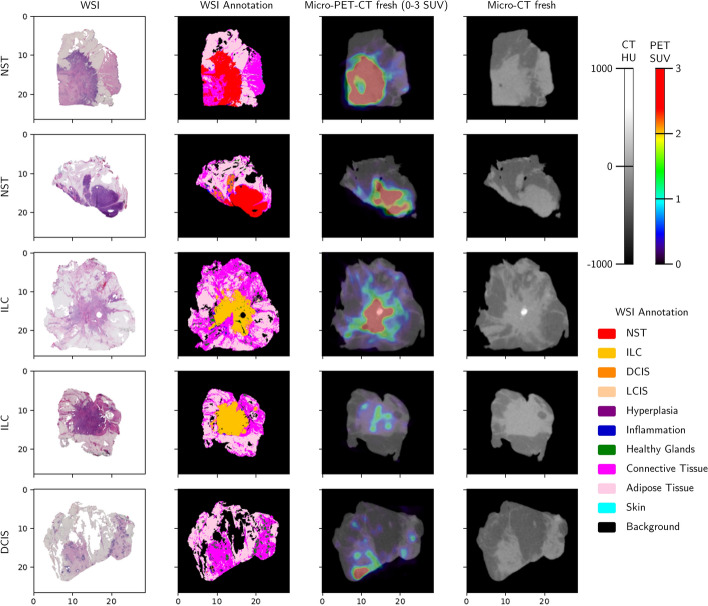
Methods: We applied our co-registration method to breast cancer (BCa) specimens of patients who were preoperatively injected with 0.8 MBq/kg [ 18 F]fluorodeoxyglucose ([18F]FDG). The method has two components. First, we used an image acquisition scheme that minimises and tracks tissue deformation: (1) We acquired sub-millimetre (micro)-PET-CT images of ±2 mm-thick lamellas of the fresh specimens, enclosed in tissue cassettes. (2) We acquired micro-CT images of the same lamellas after formalin fixation to visualise tissue deformation. (3) We obtained 1 hematoxylin and eosin (H&E) stained histopathology section per lamella of which we captured a digital whole slide image (WSI). Second, we developed an automatic co-registration algorithm to improve the alignment between the micro-PET-CT images and WSIs, guided by the micro-CT of the fixated lamellas. To estimate the spatial co-registration error, we calculated the distance between corresponding microcalcifications in the micro-CTs and WSIs. The co-registered images allowed to study standardised uptake values (SUVs) of different breast tissues, as identified on the WSIs by a pathologist.

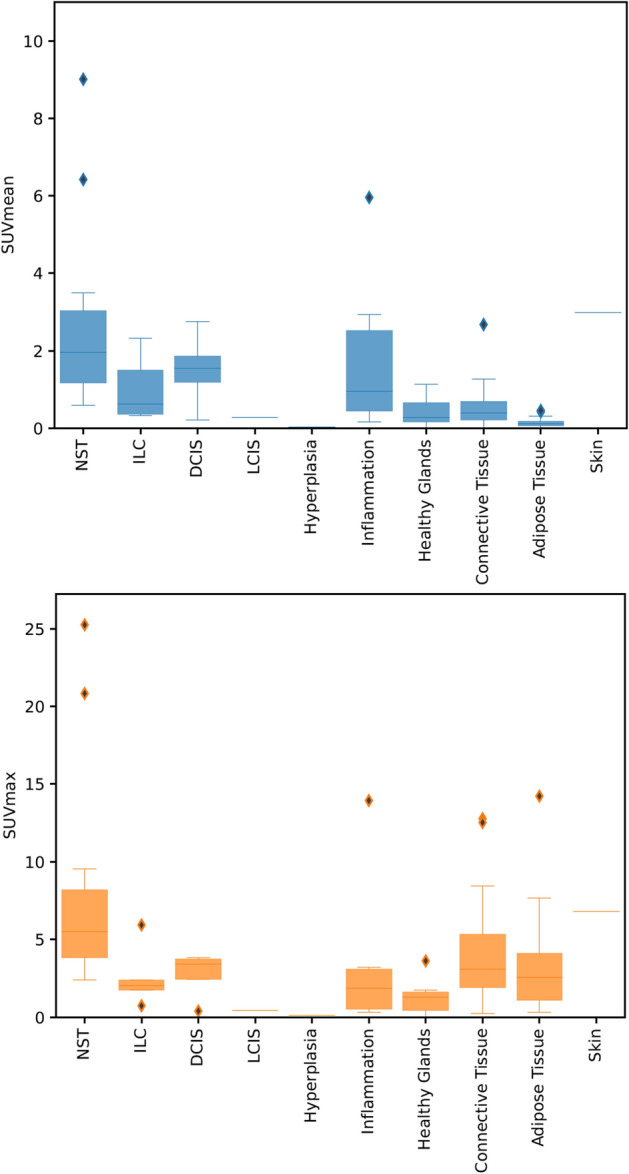
Results: We imaged 22 BCa specimens, 13 cases of invasive carcinoma of no special type (NST), 6 of invasive lobular carcinoma (ILC), and 3 of ductal carcinoma in situ (DCIS). While the cassette framework minimised tissue deformation, the best alignment between the micro-PET-CT images and WSIs was achieved after deformable co-registration. We found an overall average co-registration error of 0.74 ± 0.17 mm between the micro-PET images and WSIs. (Pre)malignant tissue (including NST, ILC, and DCIS) generally showed higher SUVs than healthy tissue (including healthy glandular, connective, and adipose tissue). As expected, inflamed tissue and skin also showed high uptake.

Conclusions: We developed a method to co-register micro-PET-CT images of surgical specimens and WSIs with an accuracy comparable to the spatial resolution of the micro-PET images. While currently, we only applied this method to BCa specimens, we believe this method is applicable to a wide range of specimens and radiotracers, providing insight into distributions of (new) radiotracers in human malignancies at a sub-millimetre resolution.

Keywords: Breast cancer SUVs; Co-registration method; High-resolution (micro-)PET-CT; Histopathology; Radiotracer distributions.


Conflict of interest statement

LM is a research engineer at XEOS Medical, and VK is a shareholder and board member of XEOS Medical. MG, JD, KDM, BVdB, JVD, KVdV, and CV declare that they have no conflict of interest.

Figures

Fig. 1
Fig. 1
Illustration of the proposed image acquisition scheme for a breast cancer specimen. (1) Specimen is sliced into ±2 mm-thick lamellas. (2) Fresh lamellas are enclosed in tissue cassettes and (3) micro-PET-CT images of the fresh tissue are acquired. (4) Lamellas are fixated in formalin and (5) micro-CT images of the fixated tissue are acquired. (6) Lamellas are embedded in paraffin. (7) ±5 μm-thin tissue sections are cut, mounted on glass slides, and coloured using a hematoxylin and eosin (H&E) staining, and (8) digital whole slide images (WSIs) are captured from these pathology slides
Fig. 2
Fig. 2
Illustration of the four-step co-registration algorithm
Fig. 3
Fig. 3
Overview of images collected for one breast lamella. (1) Micro-PET-CT image of the fresh lamella, (2) Micro-CT image of the lamella after formalin fixation, and (3) digital whole slide image of the hematoxylin and eosin stained thin tissue section. Only one slice is shown for the 3D micro-PET and micro-CT images. The spatial scale of the images is expressed in mm
Fig. 4
Fig. 4
Illustration of the Gaussian filtering process of a tissue annotation. The figure illustrates how a full resolution annotation with an isotropic pixel size of 3.6 μm is turned into a Gaussian filtered annotation with an isotropic pixel size of 100 μm. The Gaussian kernel with full width at half maximum (FWHM) of 1 mm is scanned over the original annotation with a stride of 100 μm, and at every position the label of the tissue type with the highest relative weight is chosen. The spatial scale of the images is expressed in mm. Note that the Gaussian kernel is not displayed in its actual relative size
Fig. 5
Fig. 5
Intermediate results of the mathematical co-registration process for one breast lamella. A Alignment between the CTs of the fresh and fixated lamella after rigid, affine and B-spline co-registration. Colour fusions show the overlap between both micro-CT images, as well as their shape and composition segmentations. The overlap metrics (normalised correlation coefficient (NCC) and dice similarity coefficient (DSC)) are shown below the images. Only a central slice of the 3D micro-CT images is shown. B Alignment of the selected micro-CT slice of the fresh lamella with the histopathology whole slide image (WSI) after rigid, affine and B-spline co-registration. Chequerboards show the overlap between the micro-CT image and WSI, and colour fusions show the overlap between their shape and composition segmentations. The overlap metrics (normalised mutual information (NMI) and DSC) are shown below the images
Fig. 6
Fig. 6
Overview of the alignment between the micro-PET-CT images and histopathology whole slide images (WSIs) after mathematical co-registration. Representative lamellas containing different breast tumours are shown: 2 carcinomas of no special type (NST), 2 invasive lobular carcinomas (ILCs), and 1 ductal carcinoma in situ (DCIS). For each lamella the following images are shown: the WSI, the WSI annotation, the co-registered micro-PET-CT image of the fresh lamella, and the micro-CT image without the micro-PET overlay. The original unfiltered WSI annotations are shown. Micro-PET images are displayed with an absolute window of 0-3 standardised uptake values (SUVs) and micro-CT images are shown in Hounsfield units (HUs). The spatial scale of the images is expressed in mm
Fig. 7
Fig. 7
Illustration of corresponding microcalcifications in micro-CT images and histopathology whole slide images (WSIs). The top row shows one slice of the aligned micro-CTs of the fresh and fixated lamellas after co-registration step I. The bottom row shows the aligned micro-CT slice and WSI after co-registration step III. Red crosses indicate the centres of gravity of 2 microcalcifications in all images. The spatial scale of the images is expressed in mm
Fig. 8
Fig. 8
Box plots showing the spread in standardised uptake values (SUVs) of different breast tissues. The top plot shows the spread in SUVmean, while the bottom plot shows the spread in SUVmax across all patients

Similar articles

Cited by

References

    1. Ul-Hassan F, Cook GJ. PET/CT in oncology. Clin Med. 2012;12(4):368–72. - PMC - PubMed
    1. Paydary K, Seraj SM, Zadeh MZ, Emamzadehfard S, Shamchi SP, Gholami S, et al. The evolving role of FDG-PET/CT in the diagnosis, staging, and treatment of breast cancer. Mol Imag Biol. 2019;21(1):1–10. - PubMed
    1. Meyer HJ, Wienke A, Surov A. Associations between GLUT expression and SUV values derived from FDG-PET in different tumors-a systematic review and meta analysisa. PLoS ONE. 2019;14(6): e0217781. - PMC - PubMed
    1. Schiller F, Fechter T, Zamboglou C, Chirindel A, Salman N, Jilg CA, et al. Comparison of PET/CT and whole-mount histopathology sections of the human prostate: a new strategy for voxel-wise evaluation. EJNMMI Phys. 2017;4(1):21. - PMC - PubMed
    1. Puri T, Chalkidou A, Henley-Smith R, Roy A, Barber PR, Guerrero-Urbano T, et al. A method for accurate spatial registration of PET images and histopathology slices. EJNMMI Res. 2015;5(1):64. - PMC - PubMed

LinkOut - more resources