

Classification and functional analysis of disulfidptosis-associated genes in sepsis
- PMID: 39400961
- PMCID: PMC11472650
- DOI: 10.1111/jcmm.70020
Classification and functional analysis of disulfidptosis-associated genes in sepsis
Abstract
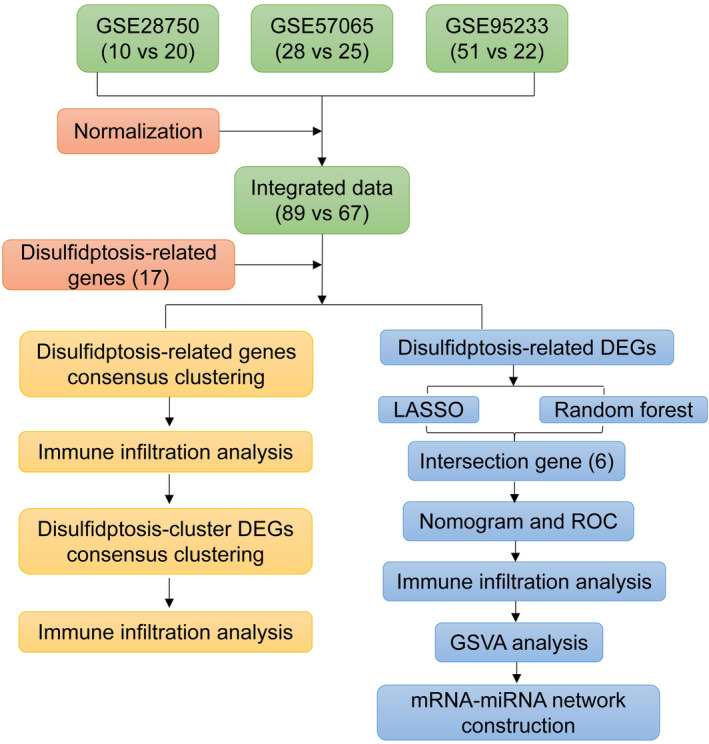
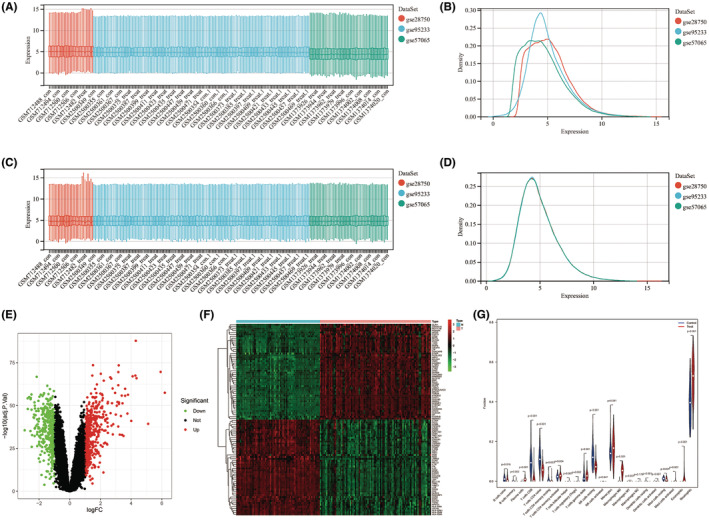
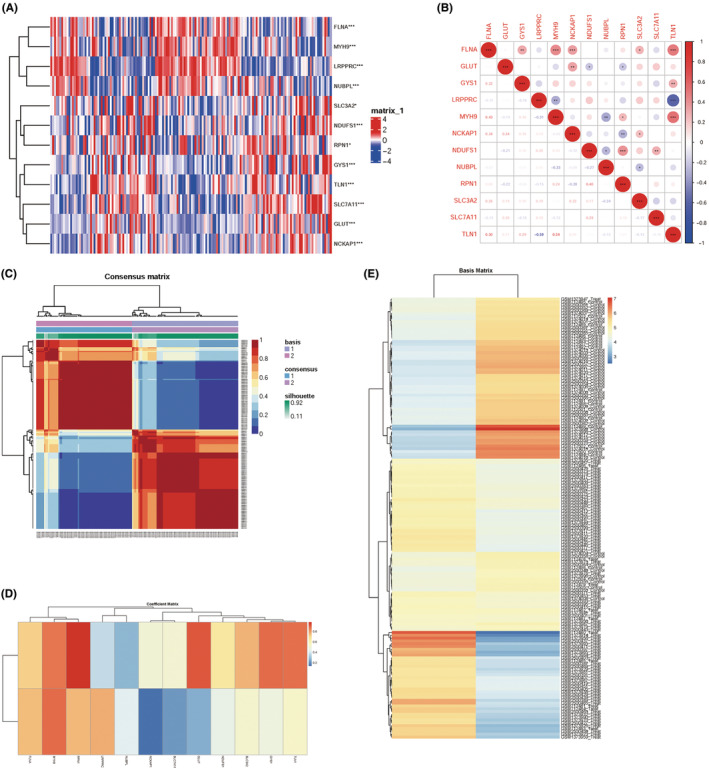
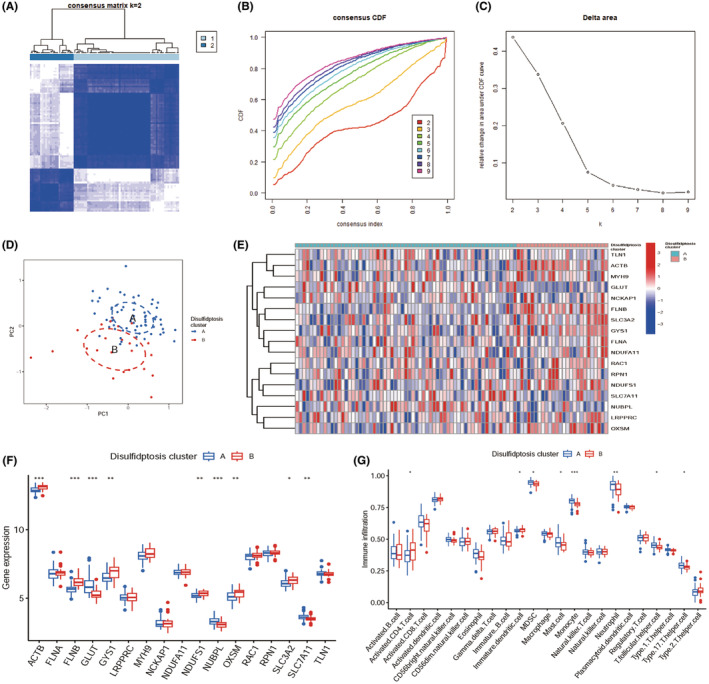
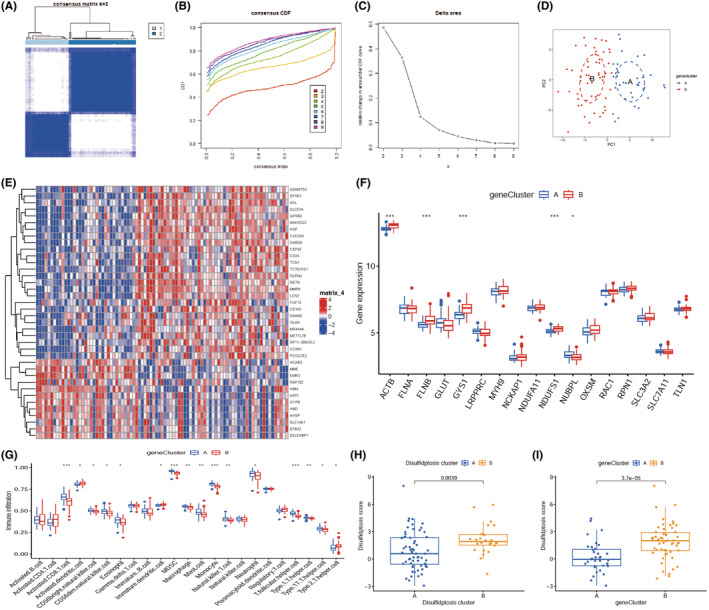
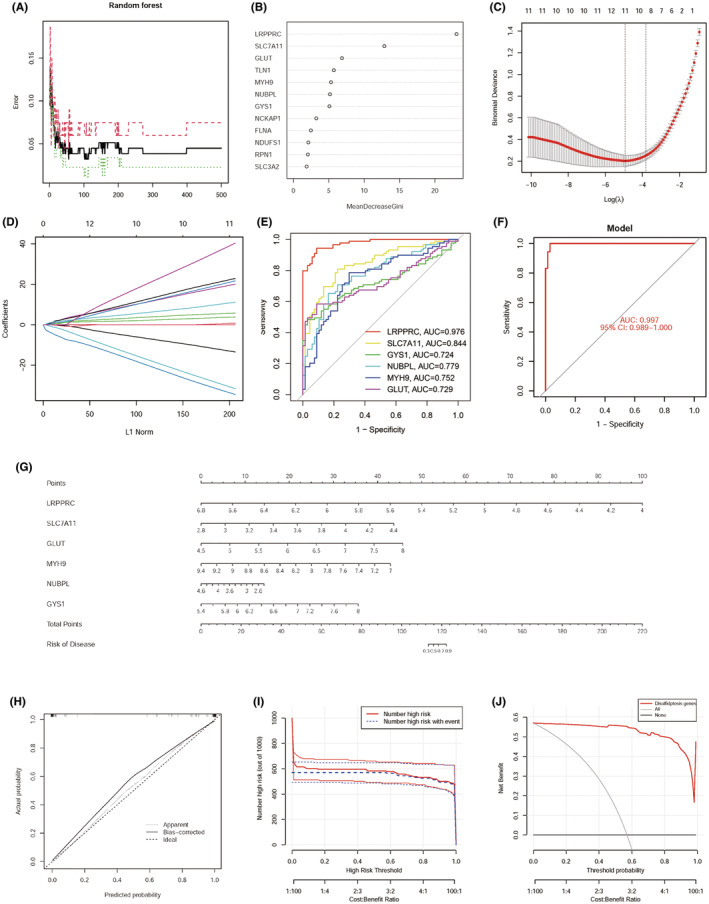
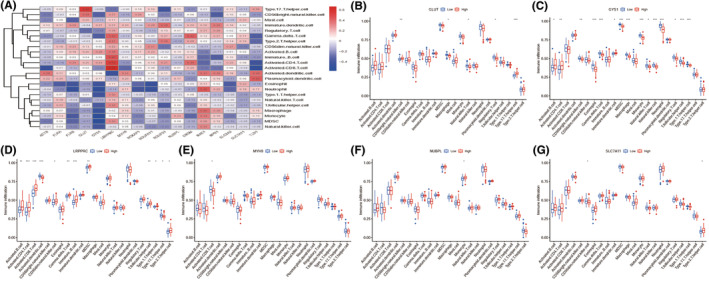
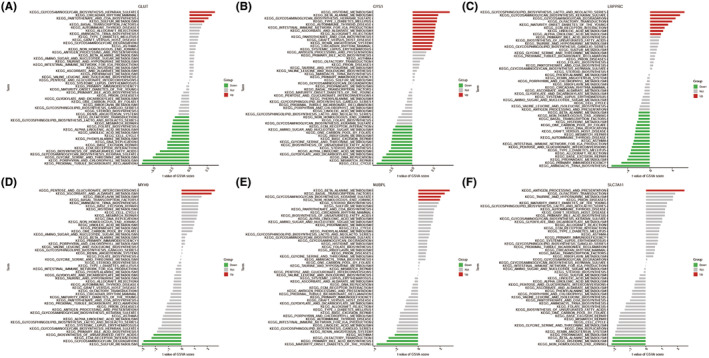
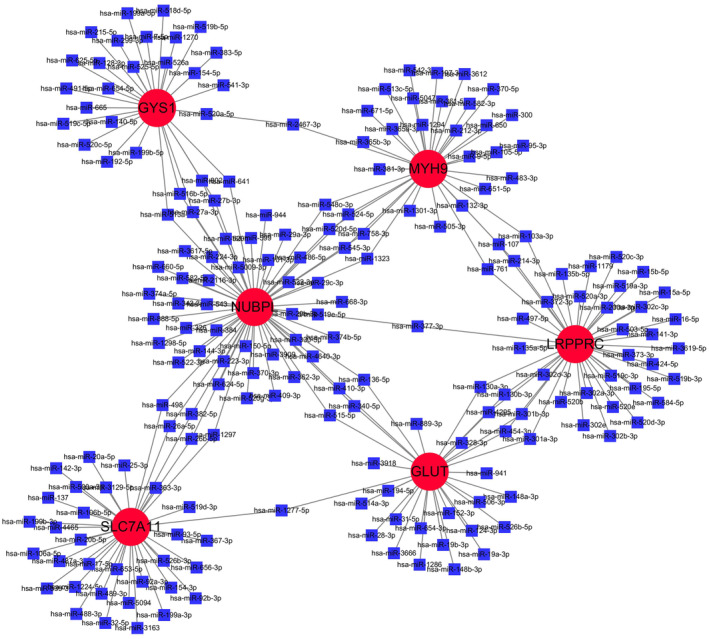
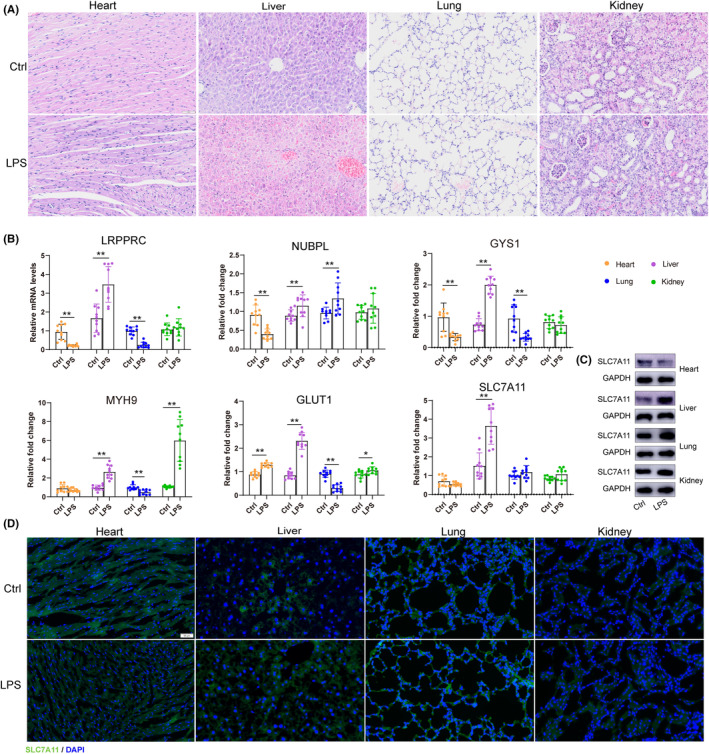
Sepsis represents a critical condition characterized by multiple-organ dysfunction resulting from inflammatory response to infection. Disulfidptosis is a newly identified type of programmed cell death that is intimately associated with the actin cytoskeleton collapse caused by glucose starvation and disulfide stress, but its role in sepsis is largely unknown. The study was to adopt a diagnostic and prognostic signature for sepsis with disulfidptosis based on the differentially expressed genes (DEGs) between sepsis and healthy people from GEO database. The disulfidptosis hub genes associated with sepsis were identified, and then developed consensus clustering and immune infiltration characteristics. Next, we evaluated disulfidptosis-related risk genes by using LASSO and Random Forest algorithms, and constructed the diagnostic sepsis model by nomogram. Finally, immune infiltration, GSVA analysis and mRNA-miRNA networks based on disulfidptosis-related DEGs were screened. There are five upregulated disulfidptosis-related genes and seven downregulated genes were filtered out. The six intersection disulfidptosis-related genes including LRPPRC, SLC7A11, GLUT, MYH9, NUBPL and GYS1 exhibited higher predictive ability for sepsis with an accuracy of 99.7%. In addition, the expression patterns of the critical genes were validated. The study provided a comprehensive view of disulfidptosis-based signatures to predict the prognosis, biological features and potential treatment directions for sepsis.
Keywords: bioinformatics; disulfidptosis; gene expression; immune infiltration; sepsis.
© 2024 The Author(s). Journal of Cellular and Molecular Medicine published by Foundation for Cellular and Molecular Medicine and John Wiley & Sons Ltd.
Conflict of interest statement
All authors disclose no conflict of interest.
Figures
Similar articles
-
Identification of disulfidptosis-related genes and subgroups in spinal cord injury.Spinal Cord. 2025 Jun;63(6):306-318. doi: 10.1038/s41393-025-01081-1. Epub 2025 May 4. Spinal Cord. 2025. PMID: 40319145
-
Unraveling pathogenesis, biomarkers and potential therapeutic agents for endometriosis associated with disulfidptosis based on bioinformatics analysis, machine learning and experiment validation.J Biol Eng. 2024 Jul 26;18(1):42. doi: 10.1186/s13036-024-00437-0. J Biol Eng. 2024. PMID: 39061076 Free PMC article.
-
Diagnostic and prognostic value of disulfidptosis-related genes in sepsis.Infect Med (Beijing). 2024 Oct 17;3(4):100143. doi: 10.1016/j.imj.2024.100143. eCollection 2024 Dec. Infect Med (Beijing). 2024. PMID: 39610785 Free PMC article.
-
Molecular signatures of disulfidptosis: interplay with programmed cell death pathways and therapeutic implications in oncology.Cell Mol Biol Lett. 2025 Jun 2;30(1):66. doi: 10.1186/s11658-025-00743-5. Cell Mol Biol Lett. 2025. PMID: 40457177 Free PMC article. Review.
-
Disulfidptosis: a novel cell death modality induced by actin cytoskeleton collapse and a promising target for cancer therapeutics.Cell Commun Signal. 2024 Oct 11;22(1):491. doi: 10.1186/s12964-024-01871-9. Cell Commun Signal. 2024. PMID: 39394612 Free PMC article. Review.
References
MeSH terms
Substances
Grants and funding
- 2021SFGC0503/the Key R&D Program of Shandong Province
- 82030059/the State Key Program of the National Natural Science Foundation of China
- 81671952/National Natural Science Foundation of China
- 81772036/National Natural Science Foundation of China
- 81873950/National Natural Science Foundation of China
- 81873953/National Natural Science Foundation of China
- 82072144/National Natural Science Foundation of China
- 82172127/National Natural Science Foundation of China
- 82302433/National Natural Science Foundation of China
- 2020YFC0846600/National Key R&D Program of China
- 2020YFC1512700/National Key R&D Program of China
- 2020YFC1512703/National Key R&D Program of China
- 2020YFC1512705/National Key R&D Program of China
- 2018FY100600/National S&T Fundamental Resources Investigation Project
- 2018FY100602/National S&T Fundamental Resources Investigation Project
- tspd20181220/Taishan Pandeng Scholar Program of Shandong Province
- tsqn20161065/Taishan Young Scholar Program of Shandong Province
- tsqn201812129/Taishan Young Scholar Program of Shandong Province
- 2018JC011/Youth Top-Talent Project of National Ten Thousand Talents Plan, Qilu Young Scholar Program and the Fundamental Research Funds of Shandong University
- ZR2023QH324/Natural Science Foundation of Shandong Province
LinkOut - more resources
Full Text Sources
Medical
Miscellaneous
