

Disparities Between Rural and Urban Communities: Response to 18 Months of Diet and Exercise Versus Control for Knee Osteoarthritis and Overweight or Obesity
- PMID: 39400996
- PMCID: PMC11684979
- DOI: 10.1002/acr.25448
Disparities Between Rural and Urban Communities: Response to 18 Months of Diet and Exercise Versus Control for Knee Osteoarthritis and Overweight or Obesity
Abstract
Objective: The study objective was to determine whether the clinical response of older adults with knee osteoarthritis and overweight or obesity to 18 months of diet and exercise (D + E) or attention control (C) interventions differed between participants from rural versus urban communities.
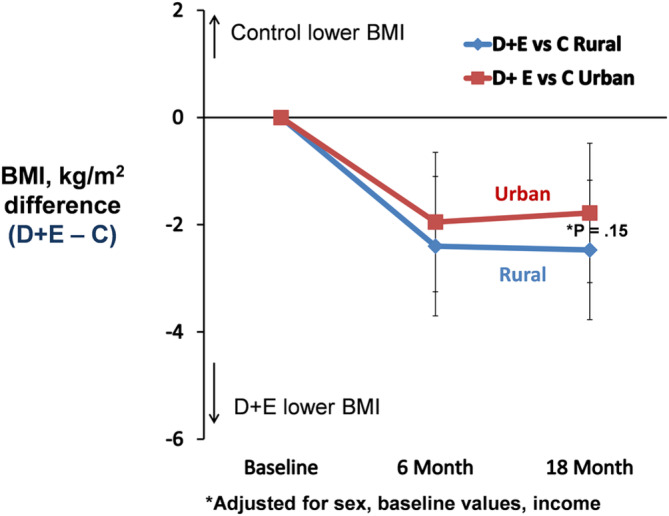
Methods: Participants were 823 older adults (mean age, 64.6 years; 77% women) with knee osteoarthritis and overweight or obesity who resided in rural (n = 410) and urban (n = 413) counties in North Carolina. All were enrolled in the Weight Loss and Exercise for Communities with Arthritis in North Carolina clinical trial that randomly assigned participants to either 18 months of D + E or C interventions. General linear models were used to examine differences in clinical outcomes between rural and urban groups after adjusting for covariates.
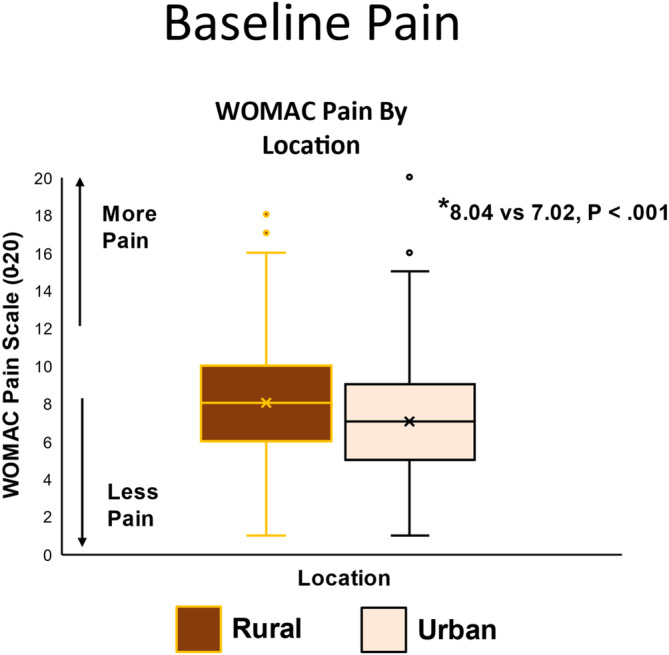
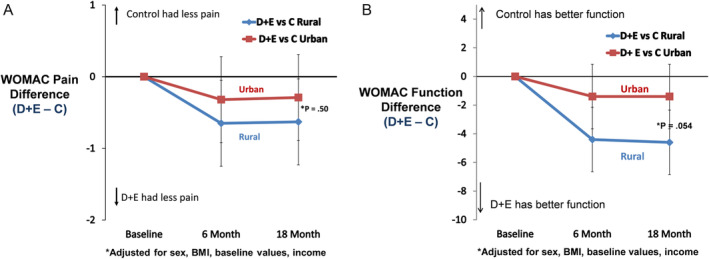
Results: The rural group had significant differences (P < 0.05) at baseline in clinical outcomes, education, comorbidities, medication use, and income compared with the urban dwellers. After adjusting for baseline differences, the group (rural or urban) by treatment (D + E or C) interactions for Western Ontario McMasters Universities Osteoarthritis Index (WOMAC) pain (rural: D + E - C = -0.63, 95% confidence interval [CI] -1.31 to 0.06; urban: D + E - C= -0.29, 95% CI -0.99 to 0.41; P = 0.50) and WOMAC function (rural: D + E - C = -4.60, 95% CI -6.89 to -2.31; urban: D + E - C = -1.38, 95% CI -3.73 to 0.94; P = 0.054) indicated that the groups responded similarly to the interventions.
Conclusion: Among participants with knee osteoarthritis and overweight or obesity, D + E compared to C led to similar pain outcomes in rural and urban dwellers that favored D + E. The possibility that there may be greater differential efficacy in functional outcomes among rural participants needs further study.
© 2024 The Author(s). Arthritis Care & Research published by Wiley Periodicals LLC on behalf of American College of Rheumatology.
Figures
References
-
- Saag KG, Doebbeling BN, Rohrer JE, et al. Arthritis health service utilization among the elderly: the role of urban‐rural residence and other utilization factors. Arthritis Care Res 1998;11(3):177–185. - PubMed
-
- Cohen SA, Cook SK, Sando TA, et al. What aspects of rural life contribute to rural‐urban health disparities in older adults? Evidence from a national survey. J Rural Health 2018;34(3):293–303. - PubMed
-
- Moreno‐Llamas A, García‐Mayor J, De la Cruz‐Sánchez E. Urban‐rural differences in perceived environmental opportunities for physical activity: a 2002‐2017 time‐trend analysis in Europe. Health Promot Int 2023;38(4):daad087. - PubMed
Publication types
MeSH terms
Grants and funding
LinkOut - more resources
Full Text Sources
Medical
