

The Role of Visualization in Estimating Cardiovascular Disease Risk: Scoping Review
- PMID: 39401079
- PMCID: PMC11519570
- DOI: 10.2196/60128
The Role of Visualization in Estimating Cardiovascular Disease Risk: Scoping Review
Abstract
Background: Supporting and understanding the health of patients with chronic diseases and cardiovascular disease (CVD) risk is often a major challenge. Health data are often used in providing feedback to patients, and visualization plays an important role in facilitating the interpretation and understanding of data and, thus, influencing patients' behavior. Visual analytics enable efficient analysis and understanding of large datasets in real time. Digital health technologies can promote healthy lifestyle choices and assist in estimating CVD risk.
Objective: This review aims to present the most-used visualization techniques to estimate CVD risk.
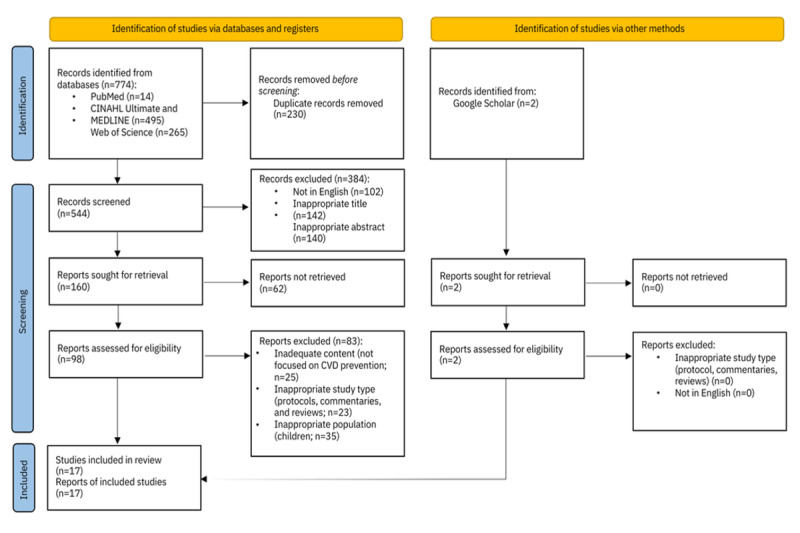
Methods: In this scoping review, we followed the Joanna Briggs Institute PRISMA-ScR (Preferred Reporting Items for Systematic Reviews and Meta-Analyses extension for Scoping Reviews) guidelines. The search strategy involved searching databases, including PubMed, CINAHL Ultimate, MEDLINE, and Web of Science, and gray literature from Google Scholar. This review included English-language articles on digital health, mobile health, mobile apps, images, charts, and decision support systems for estimating CVD risk, as well as empirical studies, excluding irrelevant studies and commentaries, editorials, and systematic reviews.
Results: We found 774 articles and screened them against the inclusion and exclusion criteria. The final scoping review included 17 studies that used different methodologies, including descriptive, quantitative, and population-based studies. Some prognostic models, such as the Framingham Risk Profile, World Health Organization and International Society of Hypertension risk prediction charts, Cardiovascular Risk Score, and a simplified Persian atherosclerotic CVD risk stratification, were simpler and did not require laboratory tests, whereas others, including the Joint British Societies recommendations on the prevention of CVD, Systematic Coronary Risk Evaluation, and Framingham-Registre Gironí del COR, were more complex and required laboratory testing-related results. The most frequently used prognostic risk factors were age, sex, and blood pressure (16/17, 94% of the studies); smoking status (14/17, 82%); diabetes status (11/17, 65%); family history (10/17, 59%); high-density lipoprotein and total cholesterol (9/17, 53%); and triglycerides and low-density lipoprotein cholesterol (6/17, 35%). The most frequently used visualization techniques in the studies were visual cues (10/17, 59%), followed by bar charts (5/17, 29%) and graphs (4/17, 24%).
Conclusions: On the basis of the scoping review, we found that visualization is very rarely included in the prognostic models themselves even though technology-based interventions improve health care worker performance, knowledge, motivation, and compliance by integrating machine learning and visual analytics into applications to identify and respond to estimation of CVD risk. Visualization aids in understanding risk factors and disease outcomes, improving bioinformatics and biomedicine. However, evidence on mobile health's effectiveness in improving CVD outcomes is limited.
Keywords: PRISMA; cardiovascular disease prevention; mobile phone; risk factors; visual analytics; visualization.
©Adrijana Svenšek, Mateja Lorber, Lucija Gosak, Katrien Verbert, Zalika Klemenc-Ketis, Gregor Stiglic. Originally published in JMIR Public Health and Surveillance (https://publichealth.jmir.org), 14.10.2024.
Conflict of interest statement
Conflicts of Interest: None declared.
Figures
Similar articles
-
Review and Comparative Evaluation of Mobile Apps for Cardiovascular Risk Estimation: Usability Evaluation Using mHealth App Usability Questionnaire.JMIR Mhealth Uhealth. 2025 May 8;13:e56466. doi: 10.2196/56466. JMIR Mhealth Uhealth. 2025. PMID: 40341099 Free PMC article. Review.
-
Beyond the black stump: rapid reviews of health research issues affecting regional, rural and remote Australia.Med J Aust. 2020 Dec;213 Suppl 11:S3-S32.e1. doi: 10.5694/mja2.50881. Med J Aust. 2020. PMID: 33314144
-
Healthcare dashboard technologies and data visualization for lipid management: A scoping review.BMC Med Inform Decis Mak. 2024 Nov 21;24(1):352. doi: 10.1186/s12911-024-02730-w. BMC Med Inform Decis Mak. 2024. PMID: 39574106 Free PMC article.
-
The Use of Technology to Provide Mental Health Services to Youth Experiencing Homelessness: Scoping Review.J Med Internet Res. 2023 Jan 16;25:e41939. doi: 10.2196/41939. J Med Internet Res. 2023. PMID: 36645703 Free PMC article.
-
The future of Cochrane Neonatal.Early Hum Dev. 2020 Nov;150:105191. doi: 10.1016/j.earlhumdev.2020.105191. Epub 2020 Sep 12. Early Hum Dev. 2020. PMID: 33036834
Cited by
-
Review and Comparative Evaluation of Mobile Apps for Cardiovascular Risk Estimation: Usability Evaluation Using mHealth App Usability Questionnaire.JMIR Mhealth Uhealth. 2025 May 8;13:e56466. doi: 10.2196/56466. JMIR Mhealth Uhealth. 2025. PMID: 40341099 Free PMC article. Review.
References
-
- Backonja U, Haynes SC, Kim KK. Data visualizations to support health practitioners' provision of personalized care for patients with cancer and multiple chronic conditions: user-centered design study. JMIR Hum Factors. 2018 Oct 16;5(4):e11826. doi: 10.2196/11826. https://humanfactors.jmir.org/2018/4/e11826/ v5i4e11826 - DOI - PMC - PubMed
-
- Turchioe MR, Myers A, Isaac S, Baik D, Grossman LV, Ancker JS, Creber RM. A systematic review of patient-facing visualizations of personal health data. Appl Clin Inform. 2019 Aug;10(4):751–70. doi: 10.1055/s-0039-1697592. https://europepmc.org/abstract/MED/31597182 - DOI - PMC - PubMed
-
- Deniz-Garcia A, Fabelo H, Rodriguez-Almeida AJ, Zamora-Zamorano G, Castro-Fernandez M, Alberiche Ruano MD, Solvoll T, Granja C, Schopf TR, Callico GM, Soguero-Ruiz C, Wägner AM, WARIFA Consortium Quality, usability, and effectiveness of mHealth apps and the role of artificial intelligence: current scenario and challenges. J Med Internet Res. 2023 May 04;25:e44030. doi: 10.2196/44030. https://www.jmir.org/2023//e44030/ v25i1e44030 - DOI - PMC - PubMed
-
- Ooge J, Stiglic G, Verbert K. Explaining artificial intelligence with visual analytics in healthcare. Wiley Interdiscip Rev Data Min Knowl Discov. 2021 Nov 28;12(1):1–19. doi: 10.1002/widm.1427. - DOI
-
- Moradi H, Al-Hourani A, Concilia G, Khoshmanesh F, Nezami FR, Needham S, Baratchi S, Khoshmanesh K. Recent developments in modeling, imaging, and monitoring of cardiovascular diseases using machine learning. Biophys Rev. 2023 Feb;15(1):19–33. doi: 10.1007/s12551-022-01040-7. doi: 10.1007/s12551-022-01040-7.1040 - DOI - DOI - PMC - PubMed
Publication types
MeSH terms
LinkOut - more resources
Full Text Sources
