. 2024 Oct 14;20(10):e1012465.
doi: 10.1371/journal.pcbi.1012465. eCollection 2024 Oct.

Emergent order in epithelial sheets by interplay of cell divisions and cell fate regulation

Affiliations

Emergent order in epithelial sheets by interplay of cell divisions and cell fate regulation

Philip Greulich. PLoS Comput Biol. .

Abstract

The fate choices of stem cells between self-renewal and differentiation are often tightly regulated by juxtacrine (cell-cell contact) signalling. Here, we assess how the interplay between cell division, cell fate choices, and juxtacrine signalling can affect the macroscopic ordering of cell types in self-renewing epithelial sheets, by studying a simple spatial cell fate model with cells being arranged on a 2D lattice. We show in this model that if cells commit to their fate directly upon cell division, macroscopic patches of cells of the same type emerge, if at least a small proportion of divisions are symmetric, except if signalling interactions are laterally inhibiting. In contrast, if cells are first 'licensed' to differentiate, yet retaining the possibility to return to their naive state, macroscopic order only emerges if the signalling strength exceeds a critical threshold: if then the signalling interactions are laterally inducing, macroscopic patches emerge as well. Lateral inhibition, on the other hand, can in that case generate periodic patterns of alternating cell types (checkerboard pattern), yet only if the proportion of symmetric divisions is sufficiently low. These results can be understood theoretically by an analogy to phase transitions in spin systems known from statistical physics.


Conflict of interest statement

The authors have declared that no competing interests exist.

Figures

Fig 1
Fig 1. Fluorescent images of spatial arrangements of cells of two types.
Top row: (A) Muscle cells with ‘slow’ fibres (red) and ‘fast’ fibres (black) in human biceps brachii biopsies (Reprinted from [15], on CC-BY license), representing a random arrangement of cell types. (B) Hair (bright) and support cells (dark) in chick basilar papilla (Reprinted from [16], Copyright 1997 Society for Neuroscience), representing a regular, alternating cell type pattern. (C) Integrin expression (bright), marking epidermal stem cells in the basal layer of human epidermis (shown is a 1D section of a 2D epithelial sheet), representing non-random cell type patches (Reprinted from [5], with permission from Portland Press, see also images in [4]); scale bar 50μm. (Bottom row) Illustrations of qualitative features of spatial cell type arrangements, where blue and orange tiles denote two different cell types in a cell sheet. These correspond to the two cell types in the respective panels above, and also to cell types A and B in the models introduced in the Model section). (D) Illustration of a random distribution of two cell types. Random clusters can emerge but they have a fractal structure and the two cell types appear in approximately equal ratios. (E) Periodic pattern (here: with periodicity of one cell length), (F) Irregular large patches. In contrast to a random distribution, cell type clusters have smoother boundaries and single large patches may dominate, so that one cell type occur more often than the other.
Fig 2
Fig 2
Simulation results for model C, Left: for a logistic interaction function, pA,B(ni), according to (5), Right: for a Hill-type interaction function, according to (6). Top row: Order parameters ϕ (solid curve) and ϕ˜ (dashed curve) as function of the signalling strength J. The curve shows the mean order parameters ϕ and ϕ˜ of 80 simulation runs with the same parameters, and random initial conditions as described in the Methods section. Error bars are standard error of mean. The used lattice length is L = 80 (N = L2 = 6400 sites) and we simulated for 4000 MCS until computing the order parameters. Below these are corresponding configurations of cell types on the lattice (black are A-cells, white are B-cells, and the tick labels denote lattice position), for logistic interaction function (left) and Hill-type interaction function (right), for different values of J in each row.
Fig 3
Fig 3
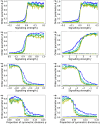
Simulation results for model R, Left: for a logistic interaction function, pA,B(ni), according to (5), Right: for a Hill-type interaction function, according to (6). Top row: Order parameters ϕ (solid curves) and ϕ˜ (dashed curves) as function of the signalling strength J, for model R, for different values of q=λλ+ω: q = 0 (blue), q = 0.2 (cyan), q = 0.4 (green), q = 0.6 (yellow), q = 0.8 (orange), q = 1 (red). Each curve shows the mean order parameters ϕ and ϕ˜ of 80 simulation runs with the same parameters, and random initial conditions as described in the Methods section. Error bars are standard error of mean. The used lattice length is L = 80 (N = L2 = 6400 sites) and we simulated for 4000 MCS until computing the order parameters. Below these are corresponding configurations of cell types shown (black are A-cells, white are B-cells, and the tick labels denote lattice position), for different values of J (rows) and q (columns) as noted at the margins (note that values of J differ between left and right panel arrays). Configurations for q = 0 and J = −0.6 (left) and J = −3.0 (right) display checkerboard patterns, which are seen best when zoomed in.
Fig 4
Fig 4. System size scaling.
Simulated order parameters ϕ (solid curves) and ϕ˜ (dashed curves) as function of J and q, for increasing system sizes L = 20 (blue), L = 40 (cyan), L = 60 (green), L = 80 (yellow) and runtimes L2/2 MCS. Each curve shows the mean order parameters ϕ and ϕ˜ of 80 simulation runs with the same parameters, and random initial conditions as described in the Methods section. Error bars are standard error of mean. Left column: For logistic interaction function, pA,B(ni), according to (5). Right column: For Hill-type interaction function, according to (6). Top row: ϕ(J) and ϕ˜(J) for model C. 2nd row: ϕ(J) and ϕ˜(J) for model R, with q = 0.5. 3rd row: ϕ(J) and ϕ˜(J) for model R, with q = 0.05 (left) and q = 0.02 (right). Bottom row: ϕ(q) and ϕ˜(q) for J = −2.0 (left), and J = −5.0 (right).
Fig 5
Fig 5. MSUM p1-p2 phase space.
Depiction of our model’s implied MSUM parameters p1 and p2 as function of J, p(J) = (p1(J), p2(J)), within the p1-p2 parameter plane, according to (13) and (15) (when substituting (5) and (6), respectively). Displayed are curves for model C in steady state (black) and for model R and different values of q: q = 0 (blue), q = 0.4 (green), q = 0.8 (red). Left: for a logistic interaction function, (5). Right: for a Hill-type interaction function, (6). The dots on curves denote the (p1, p2) values for J = 0, and the arrows show the direction of increasing J. The dashed black line is a sketch of the phase transition line according to [52], which is of the Ising universality class, except for the point pv = (0.75, 1) which corresponds to the voter model (no exact form for the phase transition curve is available, except for the point p = pv).

References

    1. Hoang DT, Matsunari H, Nagaya M, Nagashima H, Millis JM, Witkowski P, et al.. A conserved rule for pancreatic islet organization. PLoS ONE. 2014;9:e110384. doi: 10.1371/journal.pone.0110384 - DOI - PMC - PubMed
    1. Proshchina AE, Krivova YS, Barabanov VM, Saveliev SV. Pancreatic endocrine cell arrangement during human ontogeny. Acta Histochemica. 2019;121:638. doi: 10.1016/j.acthis.2019.05.010 - DOI - PubMed
    1. Hartman BH, Reh TA, Bermingham-McDonogh O. Notch signaling specifies prosensory domains via lateral induction in the developing mammalian inner ear. Proceedings of the National Academy of Sciences of the United States of America. 2010;107:15792. doi: 10.1073/pnas.1002827107 - DOI - PMC - PubMed
    1. Jones PH, Harper S, Watt FM. Stem cell patterning and fate in human epidermis. Cell. 1995;80:83. doi: 10.1016/0092-8674(95)90453-0 - DOI - PubMed
    1. Jones PH. Isolation and characterization of human epidermal stem cells. Clinical Science. 1996;91:141. doi: 10.1042/cs0910141 - DOI - PubMed

LinkOut - more resources