. 2024 Oct 22;121(43):e2402954121.
doi: 10.1073/pnas.2402954121. Epub 2024 Oct 14.

Gene therapy for fat-1 prevents obesity-induced metabolic dysfunction, cellular senescence, and osteoarthritis

Affiliations

Gene therapy for fat-1 prevents obesity-induced metabolic dysfunction, cellular senescence, and osteoarthritis

Ruhang Tang et al. Proc Natl Acad Sci U S A. .

Abstract

Obesity is one of the primary risk factors for osteoarthritis (OA), acting through cross talk among altered biomechanics, metabolism, adipokines, and dietary free fatty acid (FA) composition. Obesity and aging have been linked to cellular senescence in various tissues, resulting in increased local and systemic inflammation and immune dysfunction. We hypothesized that obesity and joint injury lead to cellular senescence that is typically associated with increased OA severity or with aging and that the ratio of omega-6 (ω-6) to omega-3 (ω-3) FAs regulates these pathologic effects. Mice were placed on an ω-6-rich high-fat diet or a lean control diet and underwent destabilization of the medial meniscus to induce OA. Obesity and joint injury significantly increased cellular senescence in subcutaneous and visceral fat as well as joint tissues such as synovium and cartilage. Using adeno-associated virus (AAV) gene therapy for fat-1, a fatty acid desaturase that converts ω-6 to ω-3 FAs, decreasing the serum ω-6:ω-3 FA ratio had a strong senomorphic and therapeutic effect, mitigating metabolic dysfunction, cellular senescence, and joint degeneration. In vitro coculture of bone marrow-derived macrophages and chondrocytes from control and AAV8-fat1-treated mice were used to examine the roles of various FA mediators in regulating chondrocyte senescence. Our results suggest that obesity and joint injury result in a premature "aging" of the joint as measured by senescence markers, and these changes can be ameliorated by altering FA composition using fat-1 gene therapy. These findings support the potential for fat-1 gene therapy to treat obesity- and/or injury-induced OA clinically.

Keywords: AAV; gene therapy; obesity; osteoarthritis; senescence.


Conflict of interest statement

Competing interests statement:F.G. is an employee and shareholder in Cytex Therapeutics, Inc. R.T., N.S.H., C.-L.W., and F.G. have received royalties from Agathos Biologics.

Figures

Fig. 1.
Fig. 1.
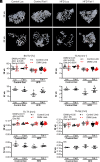
Systemic obesity characteristics at 28 and 52 wks of age after HFD and destabilization of the medial meniscus (DMM). (A) Experimental timeline (total n = 16/group with outcome measure group sizes limited by sample availability). (B) Body weights of mice at the endpoints showed a small but significant decrease in body weight in the AAV-fat1 treated groups relative to AAV-luc treated mice. (C) Representative microCT images of abdominal adipose tissue. (D) Measured % adipose tissue showed significant diet and treatment at 28 wk. (E) Representative adipose tissue H&E stains. (Scale bar: 100 µm.) (F) Adipocyte diameter (µm) showed a significant treatment effect in the HFD group at 52 wk. Data are presented as mean ± SD, two-way ANOVA with Tukey’s post hoc test, datasets not sharing the same letter are statistically different with a significance level defined as p < 0.05, main effects only reported if no significant interaction term, NS: no significant differences.
Fig. 2.
Fig. 2.
Systemic metabolic dysfunction characteristics at 28 and 52 wk of age. (A) Fasting glucose levels were increased by HFD but restored to control levels by AAV-fat1 gene therapy. (B) PGE2 and (C) PGE3 levels in serum were significantly altered by HFD and restored by AAV-fat1 gene therapy. (D) Ratio of PGE2/PGE3 further highlights this effect. (EH) Serum ω-6:ω-3 FA ratios showed significant increases in most ω-6 FA species, leading to increased ω-6:ω-3 ratios that were significantly reduced by AAV-fat1 gene therapy. LA/ALA: linoleic acid/α-linolenic acid (18:2n6/18:3n3), AA/EPA: Arachidonic acid/eicosapentaenoic acid (20:4n6/20:5n3), ω-6 DPA/DHA: 4Z,7Z,10Z,13Z,16Z-docosapentaenoic acid/4Z,7Z,10Z,13Z,16Z,19Z-docosahexaenoic acid (22:5n6/22:6n3), and DTA/n-3 DPA: 4Z,7Z,10Z,13Z,16Z-docosatetraenoic acid/7Z,10Z,13Z,16Z,19Z-docosapentaenoic acid (22:4n6/22:5n3). Data are presented as mean ± SD, two-way ANOVA with Tukey’s post hoc test, datasets not sharing the same letter are statistically different with a significance level defined as p < 0.05, main effects only reported if no significant interaction term, NS: no significant differences.
Fig. 3.
Fig. 3.
Serum cytokine levels showed distinct effects of HFD and AAV-fat-1 gene therapy at 28 and 52 wk of age. (A) IL-1α. (B) IL-1β. (C) IL-6. (D) IL-4. (E) IL-10. (F) KC. (G) TNF-α. (H) MCP-1. Data are presented as mean ± SD, two-way ANOVA with Tukey’s post hoc test, datasets not sharing the same letter are statistically different with a significance level defined as p < 0.05, main effects only reported if no significant interaction term, NS: no significant differences.
Fig. 4.
Fig. 4.
Tissue-specific markers of inflammation at 28 and 52 wk of age. (A) Flow cytomic analysis of the cells from adipose tissue shows relative amounts of proinflammatory CD11c+ cells and anti-inflammatory CD206+CD301+ cells, sorted out of the CD45+CD11b+ population. (B) IHC of adipose tissue stained for CD206. (Scale bar: 100 µm.) (C) Western blots for CD206 and COX2 in adipose tissue showed significant effects of HFD that were ameliorated by AAV-fat1 gene therapy. (D) IHC of synovium confirmed increased presence of CD206+ cells with AAV-fat1 gene therapy. (Scale bar: 100 µm.) Data are presented as mean ± SD, two-way ANOVA with Tukey’s post hoc test, datasets not sharing the same letter are statistically different with a significance level defined as p < 0.05, main effects only reported if no significant interaction term, NS: no significant differences.
Fig. 5.
Fig. 5.
Senescence characteristics at 28 and 52 wk of age. HFD significantly increased the presence of senescence-associated (SA-β-Gal) staining, which was ameliorated by AAV-fat1 gene therapy. (A) SA-β-Gal staining in fresh adipose tissue. (Scale bar: total 10 mm.) (B) SA-β-Gal staining in cryosectioned adipose tissue. (Scale bar: 100 µm.) (C) Western blots of adipose tissue showed increased p21, a marker of senescence, which was reduced by AAV-fat1 gene therapy. (D) Articular cartilage showed increased staining for p16 in DMM joints with HFD, which was reduced by AAV-fat1 gene therapy. (Scale bar: 100 µm.)
Fig. 6.
Fig. 6.
OA and synovitis at weeks 28 (PTOA) and 52 (spontaneous OA) with HFD. Mice showed increases in OA severity with DMM, which was exacerbated by HFD and significantly ameliorated by AAV-fat1 gene therapy. (A) Representative Safranin-O stained sections. (Scale bar: 100 µm.) (B) Modified Mankin scores showing increased OA severity that was reduced by AAV-fat1 gene therapy. (C) Representative H&E stained sections. (Scale bar: 50 µm.) (D) Synovitis scores showed significant effects of diet, surgery, and treatment by ANOVA. Data are presented as mean ± SD, datasets not sharing the same letter are statistically different with a significance level defined as p < 0.05, main effects only reported if no significant interaction term. 28-wk data: representative images from DMM, three-way ANOVA with repeated measures and Tukey’s post hoc test. 52-wk data: two-way ANOVA and Tukey’s post hoc test.
Fig. 7.
Fig. 7.
MicroCT lateral tibial plateau data at weeks 28 (PTOA) and 52 (spontaneous OA) show significant effects of AAV treatment, DMM, and diet. (A) Representative 3D reconstructions of microCT images of trabeculae. (B) Bone volume to tissue volume ratio (BV/TV %). (C) Trabecular number (Tb.N mm-1). (D) Trabecular thickness (Tb.Th mm). (E) Trabecular separation (Tb.Sp mm). Data are presented as mean ± SD, datasets not sharing the same letter are statistically different with a significance level defined as p < 0.05, main effects only reported if no significant interaction term. 28-wk data: representative images from DMM, three-way ANOVA with repeated measures and Tukey’s post hoc test. 52-wk data: two-way ANOVA and Tukey’s post hoc test.
Fig. 8.
Fig. 8.
The effects of fat-1 on macrophage phenotype and their senomorphic effect on chondrocytes in coculture. (A) qRT-PCR of macrophages after extraction from 52-wk-old mice showed significant increases in CD206 and Pparg gene expression levels with HFD and AAV-fat1 gene therapy. (B) PGE2 and PGE3 expression levels from 3-d treatment in macrophage-conditioned media showed increased PGE2 and decreased PGE3 levels that were ameliorated by AAV-fat1 gene therapy. (C) Quantification of ROS fluorescence generation (485/533 nM) showed that HFD increased ROS levels that were ameliorated by AAV-fat1 gene therapy. These effects were confirmed by ROS and SA-β-gal staining. (D) Representative ROS staining on chondrocytes cultured in macrophage-conditioned media. (Scale bar: 300 µm.) (E) SA-β-gal staining of chondrocytes cultured in macrophage-conditioned media. (Scale bar: 200 µm.) (F) Relative amounts of p16NK4a expressed by chondrocytes after culture in macrophage-conditioned media were increased by HFD and reduced by AAV-fat1 gene therapy. Data are presented as mean ± SD, two-way ANOVA with Tukey’s post hoc test, datasets not sharing the same letter are statistically different with a significance level defined as p < 0.05, main effects only reported if no significant interaction term, NS: no significant differences.
Fig. 9.
Fig. 9.
Verification of AAV8-mediated expression over time. Methods for these experiments are detailed in supplemental materials. (A) Luciferase imaging in vivo 120 d posttail vein injection of AAV8-LUC. (B) Bioluminescence in the mouse spleen, lung, kidney, liver, heart, skeletal muscle, and fat lysates illustrating AAV8-LUC activity in both 28-wk-old and 52-wk-old control diet and HFD-fed mice. (C) Expression of fat-1 mRNA levels in the same mouse tissues as measured by qPCR in both 28-wk-old and 52-wk-old control diet and HFD-fed mice.

References

    1. Steinmetz J. D.; Global Burden of Disease Osteoarthritis Collaborators, Global, regional, and national burden of osteoarthritis, 1990–2020 and projections to 2050: A systematic analysis for the Global Burden of Disease Study 2021. Lancet Rheumatol. 5, e508–e522 (2023). - PMC - PubMed
    1. Sanchez-Adams J., Leddy H. A., McNulty A. L., O’Conor C. J., Guilak F., The mechanobiology of articular cartilage: Bearing the burden of osteoarthritis. Curr. Rheumatol. Rep. 16, 451 (2014). - PMC - PubMed
    1. Hales C. M., Carroll M. D., Fryar C. D., Ogden C. L., Prevalence of obesity and severe obesity among adults: United States, 2017–2018. NCHS Data Brief 360, 1–8 (2020). - PubMed
    1. Felson D. T., Anderson J. J., Naimark A., Walker A. M., Meenan R. F., Obesity and knee osteoarthritis. The Framingham Study. Ann. Intern. Med. 109, 18–24 (1988). - PubMed
    1. Powell A., Teichtahl A. J., Wluka A. E., Cicuttini F. M., Obesity: A preventable risk factor for large joint osteoarthritis which may act through biomechanical factors. Br. J. Sports Med. 39, 4–5 (2005). - PMC - PubMed