. 2024 Oct 22;121(43):e2317921121.
doi: 10.1073/pnas.2317921121. Epub 2024 Oct 14.

Free radical detection in precision-cut mouse liver slices with diamond-based quantum sensing

Affiliations

Free radical detection in precision-cut mouse liver slices with diamond-based quantum sensing

Yue Zhang et al. Proc Natl Acad Sci U S A. .

Abstract

Free radical generation plays a key role in many biological processes including cell communication, maturation, and aging. In addition, free radical generation is usually elevated in cells under stress as is the case for many different pathological conditions. In liver tissue, cells produce radicals when exposed to toxic substances but also, for instance, in cancer, alcoholic liver disease and liver cirrhosis. However, free radicals are small, short-lived, and occur in low abundance making them challenging to detect and especially to time resolve, leading to a lack of nanoscale information. Recently, our group has demonstrated that diamond-based quantum sensing offers a solution to measure free radical generation in single living cells. The method is based on defects in diamonds, the so-called nitrogen-vacancy centers, which change their optical properties based on their magnetic surrounding. As a result, this technique reveals magnetic resonance signals by optical means offering high sensitivity. However, compared to cells, there are several challenges that we resolved here: Tissues are more fragile, have a higher background fluorescence, have less particle uptake, and do not adhere to microscopy slides. Here, we overcame those challenges and adapted the method to perform measurements in living tissues. More specifically, we used precision-cut liver slices and were able to detect free radical generation during a stress response to ethanol, as well as the reduction in the radical load after adding an antioxidant.

Keywords: NV center; diamonds; nanodiamonds; quantum sensing.


Conflict of interest statement

Competing interests statement:R.S. is founder of the spin off company QTsense. A patent has been filed about diamond-based quantum sensing in tissues. The other authors have no conflict of interest to declare.

Figures
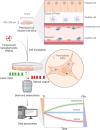
Fig. 1.
Fig. 1.
Free radical detection in mouse liver slices with diamond relaxometry. Precision-cut mouse liver slices maintain the diversity and characteristics of multicellular components in organs. FNDs were incorporated into liver slices during the 24 h incubation. In diamond relaxometry, a sequence of green laser pulses was applied to excite FNDs and optical readouts were collected afterward. After data processing, the evolution of T1 indicates the dynamics of free radicals in the presence of different treatments. An increased level of free radicals results in reduced T1 values, and vice versa. The figure was created with BioRender.
Fig. 2.
Fig. 2.
Nanodiamonds in precision-cut mouse liver slices. (A) two-photon microscopy on mouse liver slice. The image was acquired with lambda mode and each color represents a different emission band from 410 nm (purple) to 690 nm (red). Red signals are FNDs and green signals are tissue autofluorescence. (B) Immunostaining on 4 µm cryo-sections. Grey: bright field; Green: CD68 antibody-labeled Kupffer cells or CD31 antibody-labeled endothelial cells; Red: FNDs, some FNDs were indicated with a circle; Blue: DAPI-labeled nucleus. (C) Electron microscopy images of FNDs in the tissue: Tomographic slices (Left) and 3D-rendered volume of FNDs (Right).
Fig. 3.
Fig. 3.
Tissue viability of mouse liver slices in different conditions. PCLS were incubated with or without FNDs for 24 h at 37 °C, 80% O2 and 5% CO2. After that, different approaches were applied to maintain tissue viability after slices were removed from slice culture incubator for 0.5 h. One way is that PCLS were transferred to a 5% CO2/ambient O2 incubator for 0.5 h. Another way is to keep PCLS in WEGG supplemented with 10 mM HEPES buffer at 37 °C with ambient environment. The third way is to combine two methods. All data were normalized to FND group (100%). Unpaired t test was applied to compare between two groups. The whiskers are shown as mean with SD, *P < 0.05, **P < 0.01, ***P < 0.001, ****P < 0.0001.
Fig. 4.
Fig. 4.
Summary of different approaches to immobilize liver slices.
Fig. 5.
Fig. 5.
The effect of filter wavelength on the image and signal quality. (A) The same area of a liver slice with internalized FNDs was imaged with different filters (600 nm long-pass, 650 nm long-pass, or 700 nm long-pass). As the overall signal intensity drops, the internalized FNDs (green circle) become more apparent. Calibration bars show fluorescence intensity in photon counts integrated over 1 ms. (B) Comparison of the fluorescence intensity of FNDs, tissue autofluorescence, and recorded T1 values under different filter wavelengths for three individual FNDs. FND#1 comes from a batch of smaller FNDs with an average hydrodynamic diameter of 70 nm, whereas FND#2 and FND#3 have a size of 120 nm, like FNDs used in the rest of the study. Red bars and yellow bars show the fluorescence intensity of the FND and black bars the average intensity of the tissue autofluorescence. The green line shows the SNR, defined in this case as the ratio between the FND fluorescence intensity and the tissue autofluorescence intensity. The blue line indicates the T1 values recorded from the same FND under different filter settings. The error bars show 95% CI for the calculated T1 values.
Fig. 6.
Fig. 6.
T1 measurements at different locations in a single liver slice. (A) A total of 42 measurements on different FNDs located within 3 randomly chosen areas of 50 × 50 µm show no statistically significant differences between the locations. (B) Linear regression shows no significant relationship between the T1 values and the depth within the liver slice (measured from the bottom of the slice). P-values indicate the significance of the slope deviation from zero. Depth is recorded from the surface of the slice and is consistent between three locations.
Fig. 7.
Fig. 7.
T1 evolution in liver slices exposed to different triggers. (A) 25 mM ethanol (red) results in a rapid drop in T1 values recorded from the FNDs in the liver slices, whereas 0.6 mM L-ascorbic acid (green) has the opposite effect. The baseline timepoint is indicated as “−1” min. All T1 values are normalized to the corresponding baseline T1 values, recorded from the same FNDs. Points show the medians of five independent measurements on different liver slices. Error bars indicate the interquartile range. (B) Pairwise comparison of the baseline T1 values (“Before”) and final T1 values (“After”) for each experimental setup. Ethanol results in lower T1 values after 33 min of incubation, whereas L-ascorbic acid treatment produces generally higher T1 values, although not reaching statistical significance. Medium (the negative control) does not have a clear effect on the recorded T1 values.
Fig. 8.
Fig. 8.
Free radical load in young vs. old mice. We compared the radical load by conducting T1 measurements in PCLS from 12 wk and 80 wk old mice.

Similar articles

References

    1. Rondin L., et al. , Magnetometry with nitrogen-vacancy defects in diamond. Rep. Prog. Phys. 77, 056503 (2014). - PubMed
    1. Mamin H. J., et al. , Nanoscale nuclear magnetic resonance with a nitrogen-vacancy spin sensor. Science 339, 557–560 (2013). - PubMed
    1. Grinolds M. S., et al. , Nanoscale magnetic imaging of a single electron spin under ambient conditions. Nat. Phys. 9, 215–219 (2013).
    1. Hong S., et al. , Nanoscale magnetometry with NV centers in diamond. MRS Bull. 38, 155–161 (2013).
    1. McCoey J. M., et al. , Rapid, high-resolution magnetic microscopy of single magnetic microbeads. Small 15, 1805159 (2019). - PubMed

LinkOut - more resources