. 2024 Dec;11(45):e2405441.
doi: 10.1002/advs.202405441. Epub 2024 Oct 14.

The Tumor Suppressor TPD52-Governed Endoplasmic Reticulum Stress is Modulated by APCCdc20

Affiliations

The Tumor Suppressor TPD52-Governed Endoplasmic Reticulum Stress is Modulated by APCCdc20

Weichao Dan et al. Adv Sci (Weinh). 2024 Dec.

Abstract

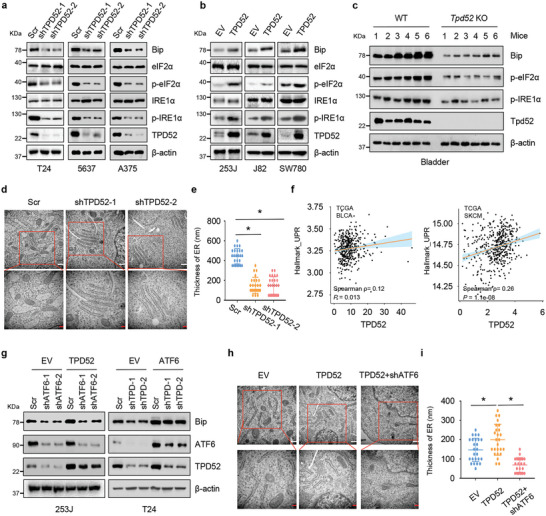
Aberrant regulation of unfolded protein response (UPR)/endoplasmic reticulum (ER) stress pathway is associated with cancer development, metastasis, and relapse, and the UPR signal transducer ATF6 has been proposed as a diagnostic and prognostic marker for many cancers. However, a causal molecular link between ATF6 activation and carcinogenesis is not established. Here, it is found that tumor protein D52 (TPD52) integrates ER stress and UPR signaling with the chaperone machinery by promoting S2P-mediated cleavage of ATF6. Although TPD52 has been generally considered as an oncogene, TPD52 is identified as a novel tumor suppressor in bladder cancer. Significantly, attenuation of the ER stress via depletion of TPD52 facilitated tumorigenesis in a subset of human carcinomas. Furthermore, the APCCdc20 E3 ligase is validated as the upstream regulator marking TPD52 for polyubiquitination-mediated proteolysis. In addition, inactivation of Cdc20 sensitized cancer cells to treatment with the ER stress inducer in a TPD52-dependent manner. Thus, the study suggests that TPD52 is a novel Cdc20 substrate that may modulate ER stress to prevent tumorigenesis.

Keywords: ATF6; Cdc20; ER stress; TPD52; unfolded protein response.


Conflict of interest statement

The authors declare no conflict of interest.

Figures

Figure 1
Figure 1
TPD52 promotes ATF6 activation during the UPR. a) Anti‐TPD52 immunoprecipitates (IPs) coupled with mass spectrometry analysis (MS) to identify TPD52‐interacting proteins in T24 cells. IPs‐MS results were subjected to enrichment analysis. b) The proteins were enriched in the “protein processing in endoplasmic reticulum” categories. c) Immunoblot (IB) analysis of whole cell lysates (WCL) and anti‐TPD52 immunoprecipitates (IPs) derived from T24 cells. d) IB analysis of WCL and anti‐ATF6 IPs derived from T24 and 5637 cells. e) GST pull‐down assay revealed the direct interaction between TPD52 and ATF6. The upper panel presents the result of IB by using the antibody against Flag, and the lower Coomassie blue staining showing the gels for purified proteins. f) IB analysis of WCL and GST‐pull‐down products derived from 293T cells transfected with Flag‐ATF6 and indicated constructs of GST‐TPD52. Vec, vector. WT, wild type. g) IB analysis of WCL and anti‐Flag IPs derived from 293T cells transfected with HA‐TPD52 and indicated constructs of Flag‐ATF6. Vec, vector. WT, wild type. h‐i) Representative fluorescence photomicrographs h) and quantification i) of ATF6 in T24 cells obtained via confocal microscopy. Where indicated, 1 µg mL−1 tunicamycin (Tu) was added for 6 h before harvesting the cells. Scale bars represent 5 µm. j) IB analysis of WCL derived from T24, 5637, A375, 253J, and J82cells stably expressing indicating plasmids. Where indicated, 1 µg mL−1 Tu was added before harvesting the cells. Scr, Scramble. EV, empty vector. ATF6 (P) and (N), respectively, refer to ATF6 precursor and cleavaged form. k) IB analysis of WCL and anti‐TPD52 IPs derived from T24 cells. l) IB analysis of WCL and anti‐ATF6 IPs derived from 253J cells overexpressing TPD52 or EV. Where indicated, 1 µg mL−1 Tu was added before harvesting the cells. EV, empty vector. m) IB analysis of WCL and anti‐ATF6 IPs derived from T24 cells stably expressing shTPD52 or Scr. Where indicated, 1 µg ml−1 Tu was added before harvesting the cells. Scr, Scramble. n) IB analysis of WCL and GST‐pull‐down products derived from T24 cells transfected with indicated constructs of GST‐TPD52. Where indicated, 1 µg mL−1 Tu was added before harvesting the cells. EV, empty vector. WT, wild type.
Figure 2
Figure 2
TPD52 regulates UPR signals and ER size through ATF6. a) Immunoblot (IB) analysis of whole cell lysates (WCL) derived from T24, 5637, and A375 cells stably expressing shTPD52 or Scr. Scr, Scramble. b) IB analysis of WCL derived from 253J, J82, and SW780 cells stably overexpressing TPD52 or EV. EV, empty vector. c) IB analysis of the WCL derived from wild‐type (WT) or Tpd52‐knockout (TPD52 −/−) mice bladder tissues. d) Representative transmission electron micrographs (TEMs) image of T24 cells stably expressing shTPD52 or Scr. Where indicated, 1 µg mL−1 Tu was added before harvesting the cells. Scr, Scramble. Scale bars: 500 nm (white); 200 nm (red). e) ER thickness was quantified for the indicated TEM samples in (d). f) Spearman analysis of gene‐expression data from patients with bladder cancer (BLCA, TCGA dataset, n = 411 samples) and skin cutaneous melanoma (SKCM, TCGA dataset, n = 472 samples) was used for depicting the correlation between TPD52 and unfolded protein response (UPR). g) IB analysis of WCL derived from 253J ATF6 knockdown or control cells transduced with TPD52 lentivirus or T24 TPD52 knockdown or control cells transduced with ATF6 lentivirus. TPD, TPD52. Scr, Scramble. EV, empty vector. h) Representative TEMs image of T24 ATF6 knockdown or control cells transduced with TPD52 lentivirus. Where indicated, 1 µg mL−1 Tu was added before harvesting the cells. Scr, Scramble. EV, empty vector. Scale bars: 500 nm (white); 200 nm (red). i. ER thickness was quantified for the indicated TEM samples in (h).
Figure 3
Figure 3
TPD52‐mediated ER stress inhibits tumorigenesis through ATF6. a‐b) Representative IHC images (a) and statistical quantification (b) of TPD52 expression in bladder cancer and normal tissues using immunohistochemical staining. Scale bars: 200 µm (black); 50 µm (red). c) Immunoblot (IB) analysis of whole cell lysates (WCL) of TPD52 protein expression in bladder tumor (T) and paired adjacent normal (N) tissues from 20 bladder cancer patients. d) Quantification of TPD52 protein expression of the blot shown in (c) by using ImageJ software. e‐f) The representative side view (e) and statistical quantification (f) of wild type (WT) or Tpd52 knockout (Tpd52 −/−) mice treated with chemical carcinogen (DMBA following with TPA) for 10 weeks (n = 6 for WT mice; n = 6 for Tpd52 −/− mice). The neoplasm lesions were arrowed. g) The growth curve of T24 TPD52 knockdown or control cells. Scr, Scramble. *P < 0.05. h) IB analysis of WCL derived from T24 cells stably expressing shTPD52 or Scr and 253J cells stably overexpressing TPD52 or EV. Where indicated, 1 µg mL−1 Tu was added before harvesting the cells. Scr, Scramble. EV, empty vector. i‐j) Colony formation assays (i) and quantification (j) of T24 TPD52 knockdown or control cells treated with Tu. Error bars are mean ± s.e.m. *P < 0.05. k‐m) T24 TPD52 knockdown or control cells were subcutaneously injected into nude mice to establish xenograft model and treated with Tu (10 mg kg−1, once daily). Statistical analysis of the tumor volumes which were measured every three days and plotted individually (k). Subcutaneous xenograft tumors formed from different groups were dissected (l). Statistical analysis of the weight of the dissected xenografts tumors m). n = 5 mice per experimental group, the results indicate the mean ± S.D. Scr, Scramble. * P<0.05. n‐p) T24 TPD52 knockdown or control cells were subcutaneously injected into nude mice to establish xenograft model and treated with Bortezomib (1 mg kg−1, twice a week). Statistical analysis of the tumor volumes which were measured every three days and plotted individually n). Subcutaneous xenograft tumors formed from different groups were dissected o). Statistical analysis of the weight of the dissected xenografts tumors p). n = 5 mice per experimental group, the results indicate the mean ± S.D. Scr, Scramble.
Figure 4
Figure 4
TPD52 protein fluctuates during cell cycle progression. a) Immunoblot (IB) analysis of whole cell lysates (WCL) derived from T24 cells synchronized at M phase by nocodazole block, following by releasing back into the cell cycle for the indicated times. b) IB analysis of WCL derived from T24 cells synchronized at the late G1/S boundary by double‐thymidine block, following by releasing back into the cell cycle for the indicated times. c) IB analysis of WCL derived from T24 cells synchronized at G0 phase by serum starvation block, following by releasing back into the cell cycle for the indicated times. d) IB analysis of WCL derived from T24, 5637, and A375 cells treated with different concentration of Taxol (125, 250 and 500 nM) for 24 h. e) IB analysis of WCL derived from T24, 5637 and A375 cells treated with Taxol (500 nM) for different time (6, 12, and 24 h). f) IB analysis of WCL derived from T24 and 5637 cells treated with different concentration of nocodazole (150, 300 and 900 nM) for 24 h. g‐i) IB analysis of WCL derived from mice bladder (g), liver (h) and kidney (i) tissues treated with Taxol (10 mg kg−1) for 7 days.
Figure 5
Figure 5
Cdc20 interacts with and promotes TPD52 K48‐linked polyubiquitination and degradation. a) Immunoblot (IB) analysis of whole cell lysates (WCL) and anti‐HA immunoprecipitates (IPs) derived from 293T cells transfected with HA‐FZR1, HA‐Cdc20 and Flag‐TPD52. 30 hours post‐transfection, cells were treated with 20 µM MG132 for 6 hours before harvesting. EV, empty vector. b) IB analysis of WCL derived from HeLa cells stably expressing shFZR1 or shCdc20. Scr, Scramble. c) IB analysis of WCL derived from T24 and 5637 cells stably expressing shCdc20 or Scr. Scr, Scramble. d) IB analysis of WCL derived from T24 and 5637 cells transfected with siCdc20 or NC. NC, negative control. e) IB analysis of WCL and anti‐Cdc20 IPs derived from T24 cells. Cells were treated with 20 µM MG132 for 6 h before harvesting. f) Cdc20 knockdown cells (shCdc20) as well as parental T24 cells (Scr) were treated with 100 µg mL−1 cycloheximide (CHX) for the indicated time period before harvesting. Equal amounts of WCL were immunoblotted with the indicated antibodies. Scr, Scramble. g) The TPD52 protein abundance in (f) was quantified by ImageJ and plotted as indicated. TPD52 bands were normalized to β‐actin. h) IB analysis of WCL and Ni‐NTA pull‐down products derived from 293T cells transfected with Flag‐TPD52, HA‐Cdc20 and His‐Ub. Where indicated, 20 µM MG132 was added for 6 h before harvesting the cells. i) IB analysis of WCL and Ni‐NTA pull‐down products derived from T24 cells stably expressing shCdc20 or Scr transfected with Flag‐TPD52 and His‐Ub. Where indicated, 20 µM MG132 was added for 6 h before harvesting the cells. j) IB analysis of WCL and Ni‐NTA pull‐down products derived from 293T cells transfected with Flag‐TPD52, HA‐Cdc20 and the indicated K‐only ubiquitin mutants. Where indicated, 20 µM MG132 was added for 6 h before harvesting the cells. k) IB analysis of WCL and Ni‐NTA pull‐down products derived from 293T cells transfected with Flag‐tagged wild type (WT) and mutated TPD52 (K60R, K98R, K152R, and K179R), HA‐Cdc20 and His‐Ub. Where indicated, 20 µM MG132 was added for 6 hours before harvesting the cells. l) IB analysis of WCL derived from 293T cells transfected with HA‐Cdc20, Flag‐TPD52 WT and Flag‐TPD52 K179R mutant. Where indicated, 100 µg mL−1 CHX was added for the indicated time period before harvesting. WT, wild type. m) The TPD52 protein abundance in (l) was quantified by ImageJ and plotted as indicated. TPD52 bands were normalized to β‐actin. n) IB analysis of WCL derived from T24 cells stably expressing shCdc20 or Scr synchronized at M phase by nocodazole block, following by releasing back into the cell cycle for the indicated times. Scr, Scramble. o) IB analysis of WCL derived from T24 cells stably expressing shCdc20 or Scr treated with Taxol (500 nM, 24 h). p) IB analysis of WCL derived from T24 Cdc20 knockdown or control cells transduced with shTPD52 lentivirus. Scr, Scramble. q‐r) Colony formation assays (q) and quantification (r) of T24/5637 Cdc20 knockdown or control cells transduced with shTPD52 lentivirus. Scr, Scramble. Error bars are mean ± s.e.m. *P < 0.05.
Figure 6
Figure 6
APCCdc20 promotes TPD52 ubiquitination in a D‐box‐dependent manner. a) Sequence alignment of putative D‐box‐containing region between TPD52 proteins from various species as well as a schematic representation of the D‐box mutant (DM) generated and used in the following studies. b) Immunoblot (IB) analysis of whole cell lysates (WCL) and anti‐Flag immunoprecipitates (IPs) derived from 293T cells transfected with HA‐Cdc20, Flag‐TPD52 WT and Flag‐TPD52 DM mutant. 30 h post‐transfection, cells were treated with 20 µM MG132 for 6 h before harvesting. Vec, vector. WT, wild type. c) IB analysis of WCL and Ni‐NTA pull‐down products derived from 293T cells transfected with HA‐Cdc20, Flag‐TPD52 WT and Flag‐TPD52 DM mutant and His‐Ub. Where indicated, 20 µM MG132 was added for 6 hours before harvesting the cells. WT, wild type. d) IB analysis of WCL derived from 293T cells transfected with HA‐Cdc20, Flag‐TPD52 WT and Flag‐TPD52 DM mutant. WT, wild type. e) IB analysis of WCL derived from 293T cells transfected with HA‐Cdc20, Flag‐TPD52 WT and Flag‐TPD52 DM mutant. Where indicated, 100 µg mL−1 CHX was added for the indicated time period before harvesting. WT, wild type. f) The TPD52 protein abundance in (e) was quantified by ImageJ and plotted as indicated. g) IB analysis of WCL derived from T24 cells transfected with Flag‐TPD52 WT and Flag‐TPD52 DM mutant synchronized at M phase by nocodazole block, following by releasing back into the cell cycle for the indicated times. WT, wild type. h‐i) Colony formation assays (h) and quantification (i) of T24 TPD52 knockdown or control cells treated with Tu. T24 TPD52 knockdown cells were transfected with TPD52 WT and TPD52 DM mutant. Scr, Scramble. EV, empty vector. Error bars are mean ± s.e.m. *P < 0.05. j) IB analysis of WCL and anti‐Flag IPs derived from 293T cells transfected with Flag‐TPD52 and indicated constructs of HA‐Cdc20. Vec, vector. WT, wild type. k) Representative images of bladder cancer patient samples stained for TPD52 and Cdc20 expression by immunohistochemistry. Scale bars: 200 µm (black); 50 µm (red). l) Correlation analysis of TPD52 and Cdc20 expression in bladder cancer patient samples.
Figure 7
Figure 7
APCCdc20 attenuates ER stress‐induced cell death and anti‐tumor effects through repressing TPD52. a) Immunoblot (IB) analysis of whole cell lysates (WCL) derived from T24 cells stably expressing shCdc20 or shTPD52 treated with Tu (1 µg mL−1, 12 h). b‐c) Colony formation assays (b) and quantification (c) of T24 cells stably expressing shCdc20 or shTPD52 treated with Tu (1 µg ml−1, 12 hours). Error bars are mean ± s.e.m. *P < 0.05. d) IB analysis of WCL derived from T24 TPD52 or Cdc20 knockdown cells transfected with TPD52 WT or TPD52 DM mutant under the treatment of Tu (1 µg mL−1, 12 h) or Taxol (500 nM, 24 h). WT, wild type. e) IB analysis of WCL derived from T24 cells treated with Tu (1 µg mL−1, 12 h) or Taxol (500 nM, 24 h). f) Colony formation assays and quantification of T24 cells treated with Tu (1 µM, 12 h) or Taxol (500 nM, 24 h). Error bars are mean ± s.e.m. *P < 0.05. g) Annexin‐V/PI Flow cytometry analysis and quantification of T24 cells treated with Tu (1 µg mL−1, 12 h) or Taxol (500 nM, 24 h). Error bars are mean ± s.e.m. *P < 0.05. h‐j. T24 cells were subcutaneously injected into nude mice to establish xenograft model and treated with Taxol (10 mg kg−1; twice a week) or Bortezomib (1 mg kg−1, twice a week). Statistical analysis of the tumor volumes which were measured every three days and plotted individually h). Subcutaneous xenograft tumors formed from different groups were dissected i). Statistical analysis of the weight of the dissected xenografts tumors j). n = 5 mice per experimental group, the results indicate the mean ± S.D. Scr, Scramble. *** P<0.001; **** P<0.0001. k‐m) T24 cells stably expressing shCdc20 or shTPD52 were subcutaneously injected into nude mice to establish xenograft model and treated with Bortezomib (1 mg kg−1, twice a week). Statistical analysis of the tumor volumes which were measured every three days and plotted individually k). Subcutaneous xenograft tumors formed from different groups were dissected l). Statistical analysis of the weight of the dissected xenografts tumors m). n = 5 mice per experimental group, the results indicate the mean ± S.D. Scr, Scramble. ** P < 0.01; *** P < 0.001.

References

    1. Walter P., Ron D., Science 2011, 334, 1081. - PubMed
    1. Chen X., Cubillos‐Ruiz J. R., Nat. Rev. Cancer. 2021, 21, 71. - PMC - PubMed
    1. Hetz C., Nat. Rev. Mol. Cell Biol. 2012, 13, 89. - PubMed
    1. Hetz C., Papa F. R., Mol. Cell. 2018, 69, 169. - PubMed
    1. Hillary R. F., FitzGerald U., J. Biomed. Sci. 2018, 25, 48. - PMC - PubMed

MeSH terms

LinkOut - more resources