. 2024 Nov:209:107464.
doi: 10.1016/j.phrs.2024.107464. Epub 2024 Oct 12.

Ex vivo fluorescence-guided resection margin assessment in breast cancer surgery using a topically applied, cathepsin-activatable imaging agent

Affiliations

Ex vivo fluorescence-guided resection margin assessment in breast cancer surgery using a topically applied, cathepsin-activatable imaging agent

Daan G J Linders et al. Pharmacol Res. 2024 Nov.

Abstract

Up to 40 % of breast cancer patients have a tumor-positive resection margin (TPRM) - defined as cancer cells at the surface of the resected specimen - after breast-conserving surgery (BCS), necessitating re-resection or boost radiation. To prevent these additional treatments, intraoperative near-infrared (NIR) fluorescence imaging with the topically applied, cathepsin-activatable imaging agent AKRO-6qcICG might be used to detect TPRMs and guide additional resection. Here, to validate its performance, the agent is topically applied to all surfaces of freshly resected breast cancer specimens (n = 11 patients) and to 3-5 mm thick tissue slices of the specimens (n = 26 patients). NIR fluorescence images of the resection surfaces and tissue slices are acquired and correlated to final histopathology. AKRO-6qcICG detects TPRMs with a sensitivity, specificity, PVV, and NPV of 100 %, 67 %, 10 %, and 100 %, respectively. On the tissue slices, the fluorescence signal has a median tumor-to-background ratio of 1.8. These findings indicate that topically applied AKRO-6qcICG can visualize TPRMs ex vivo with a high sensitivity and NPV, with sufficient contrast to adjacent healthy breast tissue.

Keywords: Activatable probes; Breast cancer; Cathepsins; Fluorescence-guided surgery; Topical application.


Conflict of interest statement

Declaration of Competing Interest The authors declare the following financial interests/personal relationships which may be considered as potential competing interests: James P. Basilion reports financial support was provided by National Institutes of Health. Matthew Bogyo reports financial support was provided by National Institutes of Health. James P. Basilion reports a relationship with Akrotome Imaging that includes: board membership, consulting or advisory, equity or stocks, funding grants, and travel reimbursement. Matthew Bogyo reports a relationship with Akrotome Imaging that includes: board membership, consulting or advisory, equity or stocks, funding grants, and travel reimbursement. Brian Straight reports a relationship with Akrotome Imaging that includes: employment, equity or stocks, funding grants, and travel reimbursement. James P. Basilion has patent licensed to Akrotome Imaging. Matthew Bogyo has patent licensed to Akrotome Imaging. If there are other authors, they declare that they have no known competing financial interests or personal relationships that could have appeared to influence the work reported in this paper.

Figures
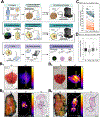
Fig. 1.
Fig. 1.
Ex vivo NIR fluorescence imaging of breast cancer using topically applied AKRO-6qcICG. (A) Graphical summary of the study workflow. (1) Standard-of-care breast cancer surgery. (2) Ex vivo topical application of AKRO-6qcICG on all resection surfaces (cranial, caudal, ventral, dorsal, medial, and lateral). (3) After 10 minutes incubation: washing off the imaging agent with saline and imaging of all resection surfaces 5 times. (4) Inking the resected specimen and slicing it into 3–5 mm thick tissue slices. (5) Topical application of AKRO-6qcICG on the entire surface of three tissue slices. (6) After 10 minutes incubation: washing off the imaging agent with saline and imaging of the three tissue slices 3–5 times. (7) Cutting the tissue slices into smaller parts and subsequent formalin fixation and paraffin embedding. (8) Cutting the FFPE tissue blocks into 4 μm thick sections and mounting those on adhesive slides. (9) Fluorescence microscopy, HE staining, and immunohistochemistry of sequential tissue slides. (B1) White light and NIR fluorescence images of a tumor-negative resection surface of patient 16. The vertical lines indicate the location of the tissue slice, of which a white light image, NIR fluorescence image and corresponding histopathology is shown in (B2). (B3) White light and NIR fluorescence images of a tumor-positive resection surface of patient 22. The vertical lines indicate the location of the tissue slice, of which a white light image, NIR fluorescence image and corresponding histopathology is shown in (B4). The TBRs on these tissue slices were 1.9 and 2.1, respectively. The arrow in c and d indicates the location of the tumor-positive margin (i.e., tumor reaching into the resection surface). (C) MFI in tumor tissue compared with adjacent healthy breast tissue on tissue slices after the final washing step (n = 66). The MFI in tumor tissue was significantly higher than in adjacent normal tissue (Wilcoxon signed-rank test, p < 0.05). The imaging agent produced at the LUMC (in blue) gave a higher fluorescence signal intensity in both tumor and healthy tissue, than the imaging agent produced at Stanford University (in orange). (D) TBR of the fluorescence signal in the tumor tissue (n = 66). Box-and-whisker plots show the minimum, first quartile, second quartile, third quartile, and maximum signal-to background ratio. There was no significant difference in TBR between the three AKRO-6qcICG concentrations (Kruskal-Wallis test, p = 0.38). Abbreviations: FFPE, formalin-fixed paraffin embedded; H&E, hematoxylin and eosin; IHC, immunohistochemistry; MFI, mean fluorescence intensity; NIR, near-infrared; TBR, tumor-to-background ratio; WL, white light.
Fig. 2.
Fig. 2.
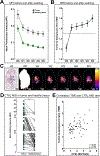
NIR fluorescence signal after consecutive washing steps and its correlation to cathepsin L expression. (A) Median MFI in tumor tissue and adjacent healthy breast tissue (or background) on tissue slices after 10 minutes of incubation before washing and after 1, 2, 3, 4, and 5 washing steps (n = 46). The vertical bars represent the standard error. (B) The median TBR after 10 minutes of incubation before washing and after 1, 2, 3, 4, and 5 washing steps (n = 46). The vertical bars represent the standard error. It is important to note that the median TBR values for each washing step in (B) were not obtained by dividing the median MFI values in tumor tissue by the median MFI values in healthy tissue in (A), but by calculating the median TBR value of the 46 tissue slices. Dividing the median MFI in tumor tissue by the median MFI in healthy tissue would not represent the median TBR, as each individual tissue slice has its unique MFI ratio between tumor and healthy tissue. (C) The effect of multiple washing steps on the fluorescence signal in one tumor-containing tissue slice. Shown are the H&E histopathology slides and the NIR fluorescence images of one tissue slice of patient 16, acquired before washing and after each washing step. The background signal decreases with each washing step. (D) The cathepsin L MSI in tumor tissue compared with adjacent healthy breast tissue (n = 66). The MSI in tumor tissue was significantly higher than in adjacent normal tissue (Wilcoxon signed-rank test, p < 0.05). (E) The correlation between the tumor-to-background ratio (TBR) of the fluorescence signal and cathepsin L MSI ratio between tumor and normal tissue in the 66 tumor-containing tissue slices. There was a moderate but significant correlation between the TBR and cathepsin L MSI ratio (Spearman’s correlation, r =.40, p < 0.05). Abbreviations: CTSL, cathepsin L; MFI, mean fluorescence intensity; MSI, mean staining intensity; TBR, tumor-to-background ratio; W, washing step.
Fig. 3.
Fig. 3.
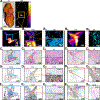
The colocalization of the NIR fluorescence signal, cathepsin L expression, and TAMs in a tumor-containing tissue slice. (A) White light and macroscopic NIR fluorescence image of one of the tumor-containing 3–5 mm thick tissue slices of patient 6. (B1–3) Zoom areas of the macroscopic and microscopic NIR fluorescence signal of the tumor. The corresponding sequential H&E histopathology and cathepsin L and CD68 stained slides of the zoom areas are shown in (C1–3), (D1–3), and (E1–3), respectively. The part of the tumor exhibiting a low fluorescence signal intensity demonstrated low levels of cathepsin L expression and did not show TAM infiltration (B3-E3, upper panel). In contrast, the part of the tumor exhibiting a high fluorescence signal intensity demonstrated high levels of cathepsin L expression and showed heightened TAM infiltration (B3-E3, lower panel). The microscopic fluorescence signal (B3) colocalized with cathepsin L expressing TAMs (D3 and E3). (B4–5) Zoom area of the macroscopic and microscopic NIR fluorescence signal in adjacent healthy breast (connective) tissue that showed a false-positive fluorescence signal. The corresponding sequential H&E histopathology and cathepsin L and CD68 stained slides are shown in (C4–5), (D4–5), and (E4–5), respectively. The false-positive connective tissue demonstrated high levels of cathepsin L expression but no TAM infiltration. Abbreviations: CTSL, cathepsin L; H&E, hematoxylin and eosin; NIR, near-infrared; TAM, tumor-associated macrophage; WL, white light.

References

    1. Sung H, Ferlay J, Siegel RL, Laversanne M, Soerjomataram I, Jemal A, Bray F, Global Cancer Statistics 2020: GLOBOCAN Estimates of Incidence and Mortality Worldwide for 36 Cancers in 185 Countries, CA Cancer J. Clin. 71 (3) (2021) 209–249. - PubMed
    1. van Bommel AC, Spronk PE, Vrancken Peeters MT, Jager A, Lobbes M, Maduro JH, Mureau MA, Schreuder K, Smorenburg CH, Verloop J, Westenend PJ, Wouters MW, Siesling S, Tjan-Heijnen VC, van Dalen T, Audit NBC, Clinical auditing as an instrument for quality improvement in breast cancer care in the Netherlands: The national NABON Breast Cancer Audit, J. Surg. Oncol. 115 (3) (2017) 243–249. - PubMed
    1. Waks AG, Winer EP, Breast cancer treatment: a review, JAMA 321 (3) (2019) 288–300. - PubMed
    1. Clarke M, Collins R, Darby S, Davies C, Elphinstone P, Evans V, Godwin J, Gray R, Hicks C, James S, MacKinnon E, McGale P, McHugh T, Peto R, Taylor C, Wang Y, Early G Breast Cancer Trialists’ Collaborative, Effects of radiotherapy and of differences in the extent of surgery for early breast cancer on local recurrence and 15-year survival: an overview of the randomised trials, Lancet 366 (9503) (2005) 2087–2106. - PubMed
    1. Fisher B, Anderson S, Bryant J, Margolese RG, Deutsch M, Fisher ER, Jeong JH, Wolmark N, Twenty-year follow-up of a randomized trial comparing total mastectomy, lumpectomy, and lumpectomy plus irradiation for the treatment of invasive breast cancer, N. Engl. J. Med 347 (16) (2002) 1233–1241. - PubMed