Case Reports
. 2024 Oct 14;12(10):e009803.
doi: 10.1136/jitc-2024-009803.

Intratumoral STING agonist reverses immune evasion in PD-(L)1-refractory Merkel cell carcinoma: mechanistic insights from detailed biomarker analyses

Affiliations
Case Reports

Intratumoral STING agonist reverses immune evasion in PD-(L)1-refractory Merkel cell carcinoma: mechanistic insights from detailed biomarker analyses

Thomas Pulliam et al. J Immunother Cancer. .

Abstract

Background: Antibodies blocking programmed death (PD)-1 or its ligand (PD-L1) have revolutionized cancer care, but many patients do not experience durable benefits. Novel treatments to stimulate antitumor immunity are needed in the PD-(L)1 refractory setting. The stimulator of interferon genes (STING) protein, an innate sensor of cytoplasmic DNA, is a promising target with several agonists in development. However, response rates in most recent clinical trials have been low and mechanisms of response remain unclear. We report detailed biomarker analyses in a patient with anti-PD-L1 refractory, Merkel cell polyomavirus (MCPyV)-positive, metastatic Merkel cell carcinoma (MCC) who was treated with an intratumoral (IT) STING agonist (ADU-S100) plus intravenous anti-PD-1 antibody (spartalizumab) and experienced a durable objective response with regression of both injected and non-injected lesions.

Methods: We analyzed pretreatment and post-treatment tumor and peripheral blood samples from our patient with single-cell RNA sequencing, 30-parameter flow cytometry, T cell receptor sequencing, and multiplexed immunohistochemistry. We analyzed cancer-specific CD8 T cells using human leukocyte antigen (HLA)-I tetramers loaded with MCPyV peptides. We also analyzed STING expression and signaling in the tumor microenvironment (TME) of 88 additional MCC tumor specimens and in MCC cell lines.

Results: We observed high levels of MCPyV-specific T cells (12% of T cells) in our patient's tumor at baseline. These cancer-specific CD8 T cells exhibited characteristics of exhaustion including high TOX and low TCF1 proteins. Following treatment with STING-agonist plus anti-PD-1, IT CD8 T cells expanded threefold. We also observed evidence of likely improved antigen presentation in the MCC TME (greater than fourfold increase of HLA-I-positive cancer cells). STING expression was not detected in any cancer cells within our patient's tumor or in 88 other MCC tumors, however high STING expression was observed in immune and stromal cells within all 89 MCC tumors.

Conclusions: Our results suggest that STING agonists may be able to work indirectly in MCC via signaling through immune and stromal cells in the TME, and may not necessarily need STING expression in the cancer cells. This approach may be particularly effective in tumors that are already infiltrated by inflammatory cells in the TME but are evading immune detection via HLA-I downregulation.

Keywords: Abscopal; Intralesional; Pathogen-Associated Molecular Pattern - PAMP; Skin Cancer; T cell.


Conflict of interest statement

Competing interests: PN reports personal fees from Pfizer, Bristol Myers Squibb, EMD Serono, Rain Therapeutics, Almirall, and Instill Bio. In addition, PN and DK have pending patents for “Merkel cell polyomavirus T antigen-specific TCRs and uses thereof” and “Novel epitopes as T cell targets in Merkel Cell Carcinoma (MCC)”. CC has a pending patent “Merkel cell polyomavirus T antigen-specific TCRs and uses thereof”. LT reports research grant funding (to institution) from Seagen and Merck. SB has received consulting or advisory role fees and honoraria from Bristol Myers Squibb, Sanofi/Regeneron, and Incyte; and has received research funding from Bristol Myers Squibb, Merck, EMD Serono, Exicure, Incyte, Checkmate Pharmaceuticals, 4SC, Seven and Eight Pharmaceuticals, Amphivena Therapeutics, TriSalus Life Sciences, Novartis and Agenus. DK reports research funding from Sanofi Pasteur. DK has received consulting or advisory fees from Curevo Vaccine and MaxHealth LLC Pasteur. KS has received consulting or advisory role fees from Sensei Biotherapeutics.

Figures

Figure 1
Figure 1. Clinical MCC course and characterization of partial response to intratumoral STING agonist+intravenous anti-PD-1 therapy. (A) Schematic of clinical course of a patient in their 60’s with multifocal metastases on left lower extremity (LLE) from MCPyV+MCC, which had progressed on prior PD-(L)1 blockade. They were enrolled on a clinical trial (NCT03172936) and received two intratumoral injections of the STING agonist (ADU-S100) plus intravenous anti-PD-1 (spartalizumab), both administered every 4 weeks. The patient experienced rapid-onset regression of both injected and non-injected lesions, with durable partial response maintained for 53 weeks before developing progression. (B) Size of injected and non-injected tumors on the LLE throughout the time course depicts a partial response to therapy with an overall decrease in disease burden of 43%. The injected tumor is shown in red with non-injected tumors in black. (C) Representative CT and PET/CT images of LLE lesions are shown prior to, during, and at the time of disease progression. MCC, Merkel cell carcinoma; MCPyV, Merkel cell polyomavirus; PD-1, programmed cell death protein-1; PD-(L)1, programmed death-ligand 1; PET, positron emission tomography; RT, radiotherapy; STING, stimulator of interferon genes.
Figure 2
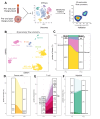
Figure 2. Intratumoral T cells increase following intralesional STING agonism. (A) Experimental overview. CITEseq was performed on pretreatment and post-treatment tumor and blood specimens for unbiased analyses. Key markers and cell populations were identified and used to design a 30-parameter flow cytometry panel to validate samples in high throughput fashion to capture rare cell populations. (B) UMAP plot of 30-parameter flow cytometry data from pre-STING and post-STING agonist treatment. Each point represents one cell colored by cell lineage. Samples were subsetted to 10,000 cells per time point for visualization purposes. (C) Alluvium plot of tumor composition before and after STING agonism showing expansion of T cells and contraction of cancer cells following treatment with STING agonist. (D) Alluvium plot of cancer cells subclustered into proliferating MCC and non-proliferating cells showing contraction of both populations. (E) Alluvium plot of T cells showing an expansion of T cells following STING agonism. All T cells expanded similarly regardless of phenotype. (F) Alluvium plot of myeloid cells before and after STING agonist treatment. A predominance of plasmacytoid dendritic cells was noted but minimal changes occurred over the course of therapy. cDC, classical dendritic cells; CITEseq, feature barcoding; CLA, cutaneous lymphocyte antigen; DNT, double negative T cells; Eff, effector; MCC, Merkel cell carcinoma; Mem, memory; Myelo, myeloid cells; Neut, neutrophils; NK, natural killer cells; pDC, plasmacytoid dendritic cells; pExh, progenitor exhausted; prolif, proliferating; STING, stimulator of interferon genes; TAM, tumor associated macrophages; tExh, terminally exhausted; TREG, Regulatory T cell; t-SNE, t-distributed stochastic neighbor embedding; UMAP, Uniform Manifold Approximation and Projection.
Figure 3
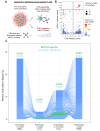
Figure 3. Intralesional STING treatment increases cancer-specific intratumoral T cell frequency. (A) Schematic of approach to quantifying frequency of MCPyV-specific CD8 T cells in tumor and blood specimens. Tumor or blood specimen were stained with DNA oligo and fluorophore labeled MHC tetramers and CITEseq with V(D)J seq was performed to identify specificity of TCRs. In parallel, beta-TCRseq was performed on tumor and blood specimens to quantify frequency of TCR clonotypes. (B) Gating of MCPyV-specific CD8 T cells via CITEseq. All cells with a single productive alpha and single productive beta TCR are shown. Cells with identical TCR sequences were grouped as clonotypes. X axis represents the median counts of CD8 antibody for each clonotype and y axis represents the median counts of an HLA-B*37:01 multimer containing a T antigen peptide. (C) Frequency of T cell clonotypes in tumor and blood before and after intralesional STING agonism. Alluvium plot where each alluvium represents and individual T cell clonotype. Clonotypes known to be MCPyV-specific are green. MCPyV-specific CD8 T cells were present in tumor and blood of patient. CITEseq, feature barcoding; HLA, human leukocyte antigen; MCPyV, Merkel cell polyomavirus; MHC, major histocompatibility complex; PBMC, peripheral blood mononuclear cells; STING, stimulator of interferon genes; TCR, T-cell receptor; tx, treatment; V(D)J, variable–diversity–joining.
Figure 4
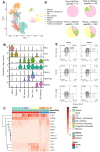
Figure 4. Cancer-specific CD8 T cells exhibit characteristics of exhaustion. (A) TSNE plot of CD8 T cells isolated in silico from single-cell RNAseq of patient tumor and blood specimens. Cells are colored by cluster. (B) Violin plots of expression of key genes in each cluster. Each row represents gene expression except for CD39 which is protein expression. (C) Heatmap of single-cell RNAseq data of CD8 T cells from tumor or blood specimen. (D) Portion of MCPyV-specific CD8 T cells in tumors in each of eight clusters. MCPyV-specific CD8 T cells in top pie charts and CD8 T cells of unknown specificity in bottom charts. Pretreatment specimen on left hand side and post-treatment on right. N in each pie chart represents number of CD8 T cells that are cancer-specific (top) or of unknown-specificity (bottom). (E) FACS plots of CD8 T cells from tumors showing expression of proteins associated with exhaustion or stem like phenotypes in cancer-specific T cells. Eff., effector; FACS, fluorescent activated cells sorting; GD, gamma delta T cells; MCPyV, Merkel cell polyomavirus; PBMC, peripheral blood mononuclear cells; PD-1, programmed cell death protein-1; TD, tumor digest; t-SNE, t-distributed stochastic neighbor embedding; tx, treatment.
Figure 5
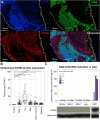
Figure 5. Merkel cell carcinoma cancer cells are deficient in STING signaling. (A) Multiplexed immunohistochemistry of post-ADU-S100 treated tumor. Areas of CD56 positivity (representing MCC cancer cells) are non-overlapping with STING positivity, which is primarily expressed in stromal and immune tissues. (B) Quantification of STING expression. Each point represents 1 of 88 unique tumor specimens on a tissue microarray. STING is universally absent in MCC cancer cells. Cancer cells defined as CD56+, CD45−, CD8 T cells defined as CD8+, Treg cells defined as CD4+, FoxP3+, macrophages defined as CD68+ or CD163+, other immune cells defined as CD45+ cells which did not fall into prior categories, stromal cells defined as CD45−, CD56− cells. Statistical comparison with one-way ANOVA compared with tumor expression. *p<0.05, **p<0.01, ****p<0.0001, NS (not significant). (C) MCC cell lines do not produce interferon-beta in response to ADU-S100 treatment. WaGa, MKL-2, MKL-1, MS1 MCC cells and THP1 cells (control human monocytic cells) were all treated with decreasing doses of ADU-S100. None of the MCC cell lines produced detectable interferon-beta at any tested ADU-S100 concentration. These cells were all also deficient in STING protein (western blot, below). ANOVA, analysis of variance; 4',6-diamidino-2-phenylindole (DAPI); Mac, macrophage; MCC, Merkel cell carcinoma; STING, stimulator of interferon genes; T-Reg, Regulatory T cell.
Figure 6
Figure 6. MCC cancer cells upregulate HLA following STING agonism. (A) scRNAseq data showing upregulation of antigen presentation genes following STING agonism on cancer cells, cancer or non-cancer cells identified in silico. Antigen presentation score calculated using 16 genes involved in the HLA-I antigen presentation pathway. (B) B2M upregulation in cancer cells but not non-cancer cells following STING agonism. (C) Quantification of HLA-I and PD-L1 expression on cancer cells via flow cytometry. Each data point represents one of two technical replicates. (D) FACS plot of HLA expression (left) or PD-L1 expression (right) on cancer cells before and after IT STING agonist treatment. T-tests with Bonferroni multiple comparison testing used for statistical significance. P value key: ns=p>0.05, *p<0.05, **p<0.01, ***p<0.001, ****p<0.0001. B2M, beta-2 microglobulin; FACS, fluorescent activated cells sorting; FMO, fluorescence minus one; HLA, major histocompatibility complex; IT, intratumoral; MCC, Merkel cell carcinoma; MHC, major histocompatibility complex; ns, not significant; PD-L1, programmed death-ligand 1; scRNAseq, single-cell RNAseq; STING, stimulator of interferon genes.

Similar articles

Cited by

References

    1. Samson N, Ablasser A. The cGAS-STING pathway and cancer. Nat Cancer. 2022;3:1452–63. doi: 10.1038/s43018-022-00468-w. - DOI - PubMed
    1. Francica BJ, Ghasemzadeh A, Desbien AL, et al. TNFα and Radioresistant Stromal Cells Are Essential for Therapeutic Efficacy of Cyclic Dinucleotide STING Agonists in Nonimmunogenic Tumors. Cancer Immunol Res. 2018;6:422–33. doi: 10.1158/2326-6066.CIR-17-0263. - DOI - PMC - PubMed
    1. Corrales L, Glickman LH, McWhirter SM, et al. Direct Activation of STING in the Tumor Microenvironment Leads to Potent and Systemic Tumor Regression and Immunity. Cell Rep. 2015;11:1018–30. doi: 10.1016/j.celrep.2015.04.031. - DOI - PMC - PubMed
    1. Downey CM, Aghaei M, Schwendener RA, et al. DMXAA causes tumor site-specific vascular disruption in murine non-small cell lung cancer, and like the endogenous non-canonical cyclic dinucleotide STING agonist, 2’3’-cGAMP, induces M2 macrophage repolarization. PLoS ONE. 2014;9:e99988. doi: 10.1371/journal.pone.0099988. - DOI - PMC - PubMed
    1. Ohkuri T, Ghosh A, Kosaka A, et al. STING contributes to antiglioma immunity via triggering type I IFN signals in the tumor microenvironment. Cancer Immunol Res. 2014;2:1199–208. doi: 10.1158/2326-6066.CIR-14-0099. - DOI - PMC - PubMed

Publication types

MeSH terms

LinkOut - more resources