

Development of an accelerometer-based wearable sensor approach for alcohol consumption detection
- PMID: 39402006
- PMCID: PMC11629442
- DOI: 10.1111/acer.15465
Development of an accelerometer-based wearable sensor approach for alcohol consumption detection
Abstract
Background: Alcohol is a commonly used substance associated with significant public health consequences. Treatment is often stigmatized and limited with regard to both access and affordability, demonstrating the need for innovations in alcohol treatment. Accelerometer sensors can detect drinking without user input and are widely incorporated into wearable devices, increasing accessibility and affordability.
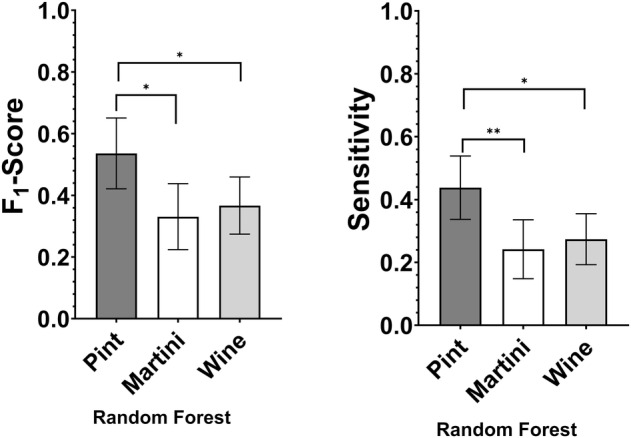
Methods: We compared a distributional and random forest classification approach to detect and evaluate sensor-based drinking data. Data were collected at a local state fair (n = 194), where participants drank water at specified intervals interspersed with confounding behaviors (e.g., touching nose, rubbing forehead, or yawning) while wearing an Android-based smartwatch for 10 min. Participants were randomized to receive one of three drinking container shapes: pint, martini, or wine.
Results: The random forest model achieved an overall testing accuracy of 93% (sensitivity = 0.32; specificity = 0.99; positive predictive value = 0.74). The distributional algorithm achieved an overall accuracy of 95% (sensitivity = 0.76; specificity = 0.97; positive predictive value = 0.72). The distributional algorithm had a significantly greater accuracy (t(193) = 7.73, p < 0.001, d = 0.56) and sensitivity (t(193) = 24.5, p < 0.001, d = 1.76). Equivalency testing demonstrated significant equivalency to the ground truth for sip duration (tlower(193) = 16.92, p < 0.001; tupper(193) = -9.85, p < 0.001) and between-sip interval (tlower(193) = 1.72, p = 0.044; thigher(193) = -3.96, p < 0.001). However, the random forest did not have significant equivalency to the ground truth for between-sip interval (tlower(193) = 1.98, p = 0.025; thigher(193) = 0.160, p = 0.564).
Conclusions: Overall, the results indicated that consumer-grade smartwatches can be utilized to detect and measure alcohol use behavior using machine learning and distributional algorithms. This work provides the methodological foundation for future research to analyze the behavioral pharmacology of alcohol use and develop accessible just-in-time clinical interventions.
Keywords: accelerometer; alcohol; classification; machine learning.
© 2024 The Author(s). Alcohol, Clinical and Experimental Research published by Wiley Periodicals LLC on behalf of Research Society on Alcohol.
Conflict of interest statement
The authors have no conflicts of interest to report.
Figures


Similar articles
-
Classification of Aggressive Movements Using Smartwatches.Sensors (Basel). 2020 Nov 9;20(21):6377. doi: 10.3390/s20216377. Sensors (Basel). 2020. PMID: 33182258 Free PMC article.
-
Using Smartwatches to Detect Face Touching.Sensors (Basel). 2021 Sep 30;21(19):6528. doi: 10.3390/s21196528. Sensors (Basel). 2021. PMID: 34640848 Free PMC article.
-
Feature selection for elderly faller classification based on wearable sensors.J Neuroeng Rehabil. 2017 May 30;14(1):47. doi: 10.1186/s12984-017-0255-9. J Neuroeng Rehabil. 2017. PMID: 28558724 Free PMC article.
-
Counting Bites With Bits: Expert Workshop Addressing Calorie and Macronutrient Intake Monitoring.J Med Internet Res. 2019 Dec 4;21(12):e14904. doi: 10.2196/14904. J Med Internet Res. 2019. PMID: 31799938 Free PMC article.
-
Machine Learning and Medication Adherence: Scoping Review.JMIRx Med. 2021 Nov 24;2(4):e26993. doi: 10.2196/26993. JMIRx Med. 2021. PMID: 37725549 Free PMC article.
References
-
- Carpenter, R.W. & Merrill, J.E. (2021) How much and how fast: alcohol consumption patterns, drinking‐episode affect, and next‐day consequences in the daily life of underage heavy drinkers. Drug and Alcohol Dependence, 218, 108407. Available from: 10.1016/j.drugalcdep.2020.108407 - DOI - PMC - PubMed
-
- Center for Behavioral Health Statistics and Quality . (2024) 2023 National Survey on Drug Use and Health (NSDUH): Methodological summary and definitions. Substance Abuse and Mental Health Services Administration. Available from: https://www.samhsa.gov/data/report/2023‐methodological‐summary‐and‐defin...
Grants and funding
LinkOut - more resources
Full Text Sources
Miscellaneous
