. 2024 Oct 14;15(1):8538.
doi: 10.1038/s41467-024-52612-y.

Resilience of genetic diversity in forest trees over the Quaternary

Affiliations

Resilience of genetic diversity in forest trees over the Quaternary

Pascal Milesi et al. Nat Commun. .

Abstract

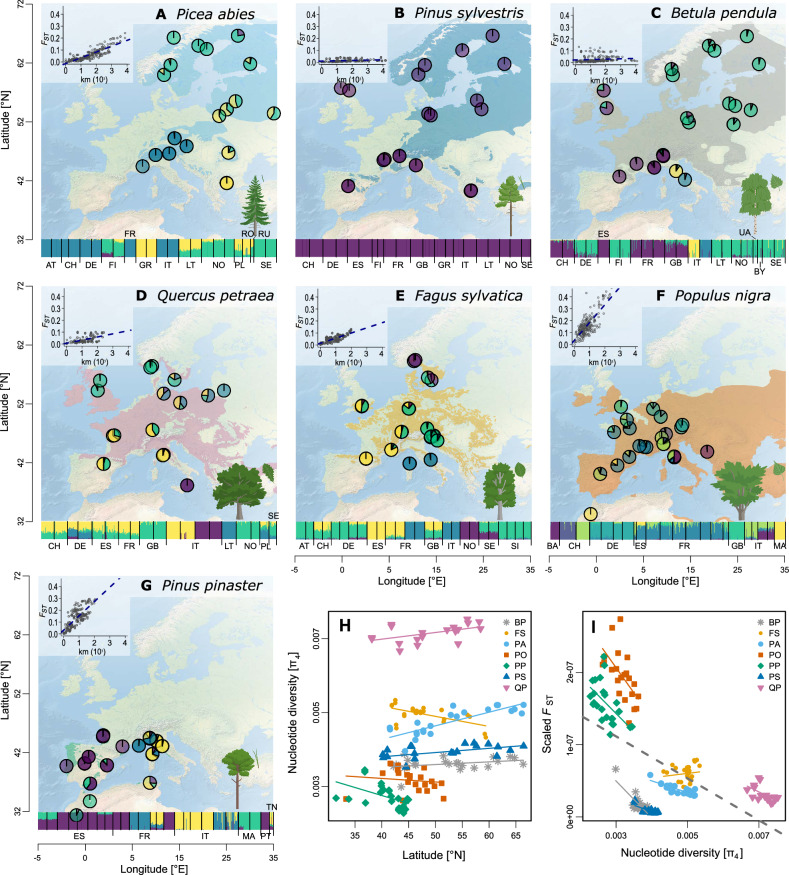
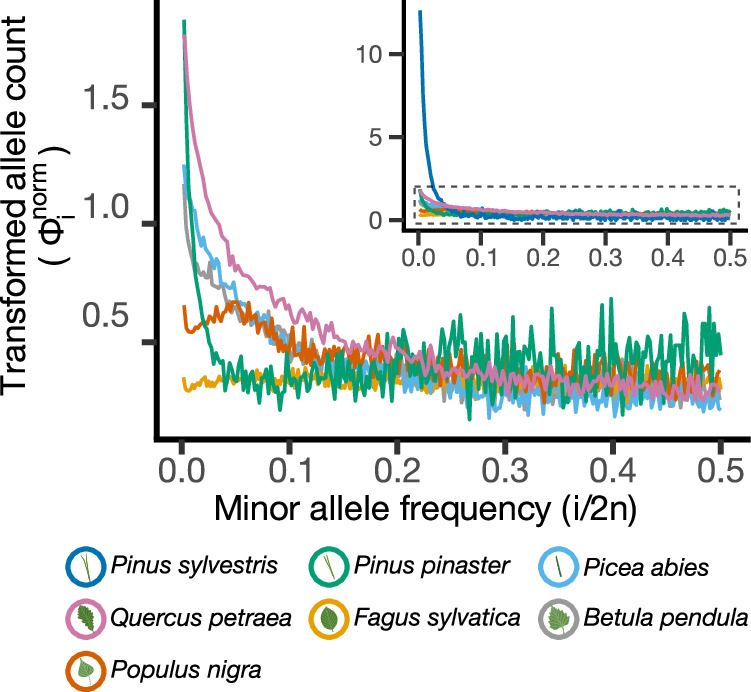
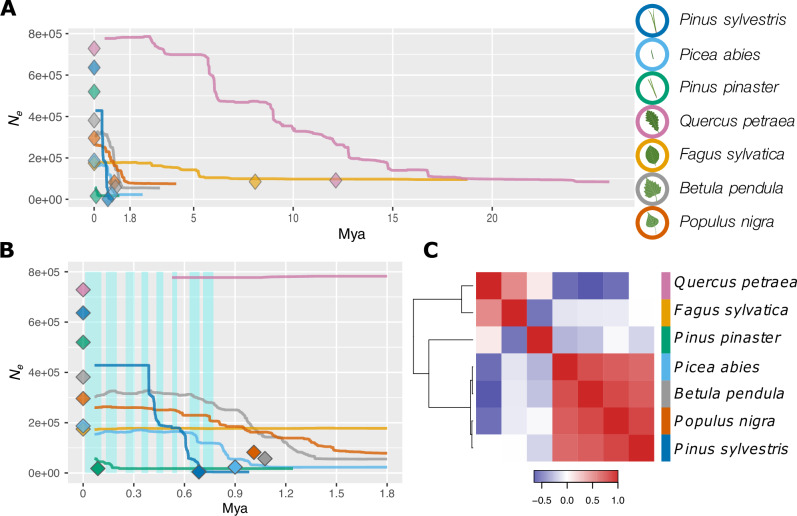
The effect of past environmental changes on the demography and genetic diversity of natural populations remains a contentious issue and has rarely been investigated across multiple, phylogenetically distant species. Here, we perform comparative population genomic analyses and demographic inferences for seven widely distributed and ecologically contrasting European forest tree species based on concerted sampling of 164 populations across their natural ranges. For all seven species, the effective population size, Ne, increased or remained stable over many glacial cycles and up to 15 million years in the most extreme cases. Surprisingly, the drastic environmental changes associated with the Pleistocene glacial cycles have had little impact on the level of genetic diversity of dominant forest tree species, despite major shifts in their geographic ranges. Based on their trajectories of Ne over time, the seven tree species can be divided into three major groups, highlighting the importance of life history and range size in determining synchronous variation in genetic diversity over time. Altogether, our results indicate that forest trees have been able to retain their evolutionary potential over very long periods of time despite strong environmental changes.


Conflict of interest statement

The authors declare no competing interests.

Figures

Fig. 1
Fig. 1. Admixture, isolation by distance, genetic diversity and divergence patterns of the seven studied European tree species.
AG Pie charts represent population average admixture coefficients. Four genetic clusters are shown to visualize genetic structure, except for Pinus sylvestris (K = 1; B) and Populus nigra (K = 7; F) (see Figs. S3–S16 for other cluster numbers). An admixture bar plot of all individuals is shown at the bottom of each panel (country codes are explained in Table S1). Background maps represent species’ ranges. Inset graphs show patterns of isolation by distance. H Nucleotide diversity at four-fold sites, π4, per base pair as a function of latitude. I Population-specific scaled differentiation estimated as the average of the ratios of pairwise Fst over pairwise distance for all population pairs as a function of π4. Different symbols and colors represent populations of the different species with their respective trend lines. Species codes are explained in Table S1. The few populations from Russia are not represented here and can be found in Figs. S1, S12. (AT Austria, BA Bosnia and Herzegovina, BY Belarus, CH Switzerland, DE Germany, ES Spain, FI Finland, FR France, GB Great Britain, GR Greece, IT Italy, LT Lithuania, MA Morocco, NO Norway, PL Poland, PT Portugal, RO Romania, RU Russia, SE Sweden, SI Slovenia, TN Tunisia, UA Ukraine, BP Betula pendula, FS Fagus sylvatica, PA Picea abies, PO Populus nigra, PP Pinus pinaster, PS Pinus sylvestris, QP Quercus petraea). Source data are provided as a Source Data file-1.
Fig. 2
Fig. 2. Folded site frequency spectra (fSFS) of all seven studied species (inset) and of the remaining six species after excluding Pinus sylvestris (with adjusted scale in the y axis).
The SFS were transformed and normalized following (see Materials & Methods) so that they are flat under the standard neutral model, facilitating the visualization of the SFS that depart from expectations of the standard neutral model,. Source data are provided as a Source Data file-1.
Fig. 3
Fig. 3. Demographic change across time for the seven tree species.
A Change in effective population size (Ne) through time (million years ago, Mya), inferred with Stairway Plot 2 (lines, one-sample-per-population dataset; see Supplementary Data 7) or with fastsimcoal2 (diamonds, 2-epoch model and one-sample-per-population dataset; see Supplementary Data 5 and 6). The median changes in Ne are reported from both methods. B A zoom-in of (A) focusing on the 0–1.8 Mya period. Blue shaded rectangles delineate glacial periods. Timing of the glacial periods was inferred from composite CO2 records publicly available at (https://www.ncei.noaa.gov/). C Heatmap based on Kendall’s correlation coefficients computed from changes in Ne through time between each pair of species. The order of species along the x-axis is the same as that along the y-axis. Blue and red colors represent negative and positive correlation values, respectively. Source data are provided as a Source Data file-1.

References

    1. Birks, H. J. B. & W, T. in European Atlas ofForest TreeSpecies (eds San-Miguel-Ayanz, J., de Rigo, D., Caudullo, G., Houston Durrant, T. & Mauri, A.) (Publication Office of the European Union, Luxembourg, 2016).
    1. Lascoux, M., Palmé, A. E., Cheddadi, R. & Latta, R. G. Impact of ice ages on the genetic structure of trees and shrubs. Philos. Trans. R. Soc. Lond. Ser. B: Biol. Sci.359, 197–207 (2004). - PMC - PubMed
    1. Kremer, A. How well can existing forests withstand climate change in: Climate Change and Forest Genetic Diversity: Implications for Sustainable Forest Management in Europe.pp. 3–17. (eds. Koskela, J., Buck, A. & Teissier du Cros, E.), (Bioversity International, Rome, 2007).
    1. Saleh, D. et al. Genome-wide evolutionary response of European oaks during the Anthropocene. Evolu. Lett.6, 4–20 (2022). - PMC - PubMed
    1. Alberto, F. J. et al. Potential for evolutionary responses to climate change - evidence from tree populations. Glob. Change Biol.19, 1645–1661 (2013). - PMC - PubMed

Publication types

LinkOut - more resources