Clinical Trial
. 2024 Oct 14;15(1):8854.
doi: 10.1038/s41467-024-53034-6.

Pre-operative stereotactic radiosurgery and peri-operative dexamethasone for resectable brain metastases: a two-arm pilot study evaluating clinical outcomes and immunological correlates

Affiliations
Clinical Trial

Pre-operative stereotactic radiosurgery and peri-operative dexamethasone for resectable brain metastases: a two-arm pilot study evaluating clinical outcomes and immunological correlates

Caroline S Jansen et al. Nat Commun. .

Abstract

Enhancing the efficacy of immunotherapy in brain metastases (BrM) requires an improved understanding of the immune composition of BrM and how this is affected by radiation and dexamethasone. Our two-arm pilot study (NCT04895592) allocated 26 patients with BrM to either low (Arm A) or high (Arm B) dose peri-operative dexamethasone followed by pre-operative stereotactic radiosurgery (pSRS) and resection (n= 13 per arm). The primary endpoint, a safety analysis at 4 months, was met. The secondary clinical endpoints of overall survival, distant brain failure, leptomeningeal disease and local recurrence at 12-months were 66%, 37.3%, 6%, and 0% respectively and were not significantly different between arms (p= 0.7739, p= 0.3884, p= 0.3469). Immunological data from two large retrospective BrM datasets and confirmed by correlates from both arms of this pSRS prospective trial revealed that BrM CD8 T cells were composed of predominantly PD1+ TCF1+ stem-like and PD1+ TCF1-TIM3+ effector-like cells. Clustering of TCF1+ CD8 T cells with antigen presenting cells in immune niches was prognostic for local control, even without pSRS. Following pSRS, CD8 T cell and immune niche density were transiently reduced compared to untreated BrM, followed by a rebound 6+ days post pSRS with an increased frequency of TCF1- effector-like cells. In sum, pSRS is safe and therapeutically beneficial, and these data provide a framework for how pSRS may be leveraged to maximize intracranial CD8 T cell responses.


Conflict of interest statement

The authors declare no competing interests.

Figures

Fig. 1
Fig. 1. pSRS can be delivered safely and effectively.
A Clinical trial schema. B Consort diagram. C Cumulative incidence curves for distant brain failure (DBF), leptomeningeal disease (LMD), and overall survival (OS) all analyzed patients. D Cumulative incidence for DBF, LMD, and OS for patients assigned to Arm A and Arm B. The p-value is calculated by Gray’s test and Log-rank test. All tests are two-sided. Source data are provided as a Source Data file.
Fig. 2
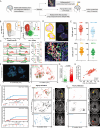
Fig. 2. TCF1+ PD1+ stem-like T cells are found in brain metastases and reside in an immunological niche.
A Schema of sample collection, processing, and analysis of BrM tissue. B Flow cytometry characterizing PD1+ TCF1+ stem-like and PD1+ TIM3+ terminally differentiated (TD) effector-like cells in BrM. Greater than 50% of CD8 T cells in BrM are PD1+ . n= 6, with median shown. C Expression (mean fluorescence intensity, or MFI) of activation markers, checkpoint molecules, and transcription factors by TD and stem-like subsets, gated as in B. Statistical significance calculated by Mann-Whitney U test, with *:p= 0.0411 **:p= 0.0043. D H&E with tumor regions outlined in yellow (left); immunofluorescence whole slide image (right) with the region of interest highlighted by the white box and zoomed immunofluorescence image demonstrating immune cell cluster (below). E Quantitation of immune cell densities, n= 67, with the median shown. F Digital reconstruction of whole slide immunofluorescence (left) and cellular spatial relationship map (right) displaying a contour of MHC-II+ cellular density and the x, y locations of TCF1+ /- CD8 T cells. G Distance between TCF1+ /- CD8 T cells and the closest MHC-II+ cell. H Percentage of total CD8 T cells correlates with the proportion of tumor tissue occupied by immune niches (n= 67). I Cumulative incidence curves associating extended local control of disease with a higher percentage of TCF1+ of CD8 T cells (left, Gray’s test two-sided, p= 0.0036) and with a higher tumor niche proportion (right, Gray’s test two-sided, p= 0.0444). J x, y location maps of CD8 T cells, MHC-II+ cells, and immune niches in a highly infiltrated cystic BrM (left) with MRI images of the pre-operative and post-operative resection cavity followed for 10-years without evidence of local recurrence (right). K x, y location maps of a poorly infiltrated BrM (left). Nodular local recurrence at the surgical cavity margin occurred at 6 months post-operatively denoted by red arrow (right). Source data are provided as a Source Data file.
Fig. 3
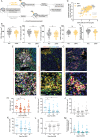
Fig. 3. The impact of pre-operative SRS on the immune niche.
A Schema of sample collection, processing, and analysis of BrM tissue including upfront resection (Res) and pre-operative SRS (pSRS) specimens. B Comparison of quantified immune cell infiltrate in Res and pSRS samples. Total CD8 cells per mm2 are lower in pSRS samples compared to Res (p= 0.0160), TCF1+ are lower in pSRS samples (*:p= 0.0223), TCF1- are lower in pSRS (*:p= 0.0452), and MHC-II+ cell per mm2 is similar in Res vs pSRS (p= 0.2642). C Proportion of tumor with immune niche is lower in pSRS compared to Res (*:p= 0.0022). In B & C, calculated by Mann–Whitney U test, n= 67 Res, n= 76 for pSRS. D Correlation between CD8 cells per mm2 and proportion of tumor with immune niche is maintained in pSRS BrM (R2 = 0.4005, p < 0.0001, as calculated by linear regression; n= 67 for Res, n= 76 for pSRS). EG Representative immunofluorescence of the immune niches and T cell subsets E at day 1, F at day 5, G and at day 9 after pSRS. HM Quantification of immune cell density at 0, 1-2, 3-5, or 6+ days following pSRS, statistical significance calculated by one-way ANOVA, n= 76. H Number of CD8 cells per mm2 decreases from day 0 to day 5 and then rebounds to baseline by day 6+ following pSRS with *:p= 0.0424, *p= 0.0285. I Number of TCF1+ CD8 cells per mm2 decrease following pSRS and remain lower at day 6+ with *:p= 0.0198, *:p= 0.0447. J) Number of TCF1- CD8 cells per mm2 have a numeric, but not statistically significant decrease from day 0-5 with a rebound by day 6+ . K Percentage of TCF1+ CD8 cells (of total CD8 T cells) significantly decreased from day 0 to day 6+ with *:p= 0.0341. L In contrast, the percentage of TCF1- CD8 cells (of total CD8 T cells) significantly increased from day 0 to day 6+ with *:p= 0.0341. M Proportion of tumor occupied by immune niches showed a numeric but not statistically significant decrease from day 0 to day 6 + . In H-M, n= 12, 33, 15, 16 for days post SRS 0, 1-2, 3-5 and 6+ respectively. IF (immunofluoresence). Source data are provided as a Source Data file.
Fig. 4
Fig. 4. pSRS shifts the dendritic cell signature towards a pro-inflammatory phenotype and promotes the accumulation of the TD1 GZMB high effector subset.
A Frequency of CD8 T cells of total live CD45+ cells across all patient tumors, as measured by flow cytometry. Medians are shown, and statistical comparisons were performed using two-sided unpaired Mann Whitney U test (n= 34). B Single cell RNAseq UMAP projection of sub-clustered CD8 T cells. C Normalized gene expression of selected differentially expressed genes defining each CD8 T cell cluster. D, E Relative cluster distribution D and total frequency of CD45+ live cells E of CD8 T cells subsets in Res (n= 18) and pSRS (n= 13) patient tumors. Medians are shown for each summary plot and statistical comparisons were performed using Mann Whitney U test between Res and pSRS groups. F, G Metascape pathway enrichment analysis in CD8 T cell subsets from pSRS tumors. Top five significant pathways are shown for F Stem-like CD8 T cells and G TD1 GZMB high CD8 T cells. H Transcriptional comparison of CD8 T cell subsets across Res and pSRS groups. The color and size of the circles represent the normalized expression and proportion of cells expressing that gene, respectively. I, J NicheNet sender-receiver analysis showing the top 3-4 predicted ligand-receptor interactions between activated DCs and CD8 T cell subsets in I Res or J pSRS. The thickness of circles and connections represents the prioritization score and interaction strength for each L-R pair. P values are shown. Source data are provided as a Source Data file and are available on the NCBI Gene Expression Omnibus (GEO) database.
Fig. 5
Fig. 5. Immunodominant clonotypic overlap is observed between the CD8 T cell subsets in Res and pSRS BrM.
Top 3 clonotypes for a representative sample of individual A Res or B pSRS BrM superimposed on the UMAP of the previously described CD8 T cell subsets (stem-like, transitory, TD1, and TD2), percentage of all cells quantified per BrM below. Highlighted clonotypes are present in all four subsets. C Percentage TCR overlap of stem-like CD8 T cells with Transitory, TD1 or TD2 in Res (left, n= 15) and pSRS (right, n= 11). Box plot shows min, max, median and interquartile range. D Quantification of the top 3 clonotypes for all BrM grouped by cluster and subdivided by treatment. Immunodominant clonotypes were enriched for in the effector subsets compared to the stem-like and transitory subsets (n= 15 Res, n= 11 pSRS). Box plot shows min, max, median and interquartile range. Source data are provided as a Source Data file and are available on the NCBI Gene Expression Omnibus (GEO) database.

Update of

References

    1. Naito, Y. et al. CD8+ T cells infiltrated within cancer cell nests as a prognostic factor in human colorectal cancer. Cancer Res. 58, 3491–3494 (1998). - PubMed
    1. Sharma, P. et al. CD8 tumor-infiltrating lymphocytes are predictive of survival in muscle-invasive urothelial carcinoma. Proc. Natl Acad. Sci. USA104, 3967–3972 (2007). - PMC - PubMed
    1. Hiraoka, K. et al. Concurrent infiltration by CD8+ T cells and CD4+ T cells is a favourable prognostic factor in non-small-cell lung carcinoma. Br. J. Cancer94, 275–280 (2006). - PMC - PubMed
    1. Dieci, M. V. et al. Immune characterization of breast cancer metastases: prognostic implications. Breast Cancer Res. 20, 62 (2018). - PMC - PubMed
    1. Im, S. J. et al. Defining CD8+ T cells that provide the proliferative burst after PD-1 therapy. Nature537, 417–421 (2016). - PMC - PubMed

Publication types

Associated data