. 2024 Oct 14;11(1):1124.
doi: 10.1038/s41597-024-03975-w.

RNA architecture of porcine deltacoronavirus genome inside virions detected by vRIC-seq

Affiliations

RNA architecture of porcine deltacoronavirus genome inside virions detected by vRIC-seq

Ju Sun et al. Sci Data. .

Abstract

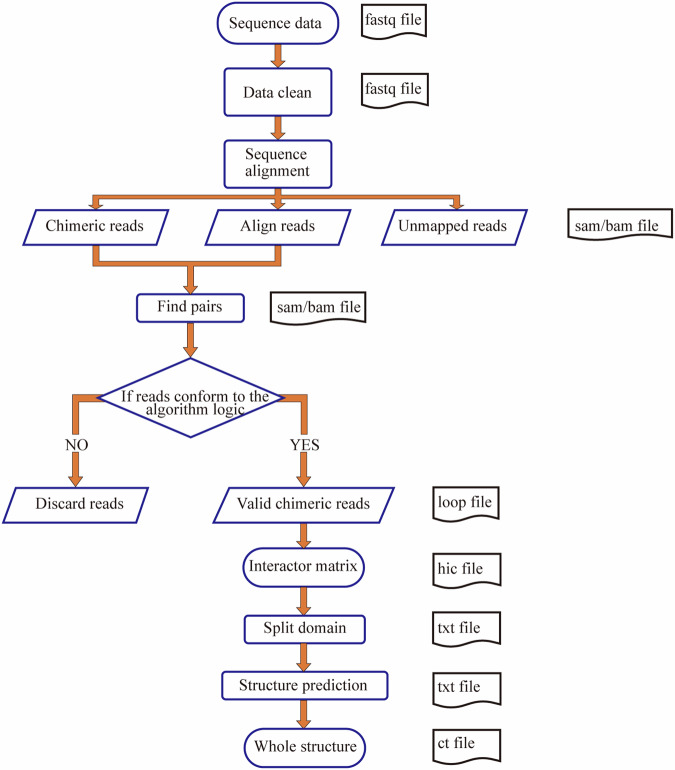
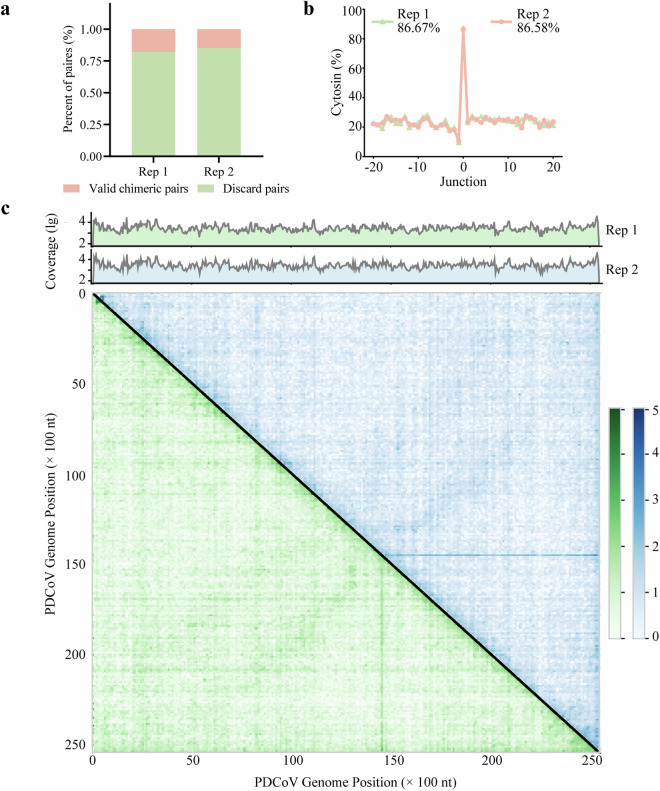
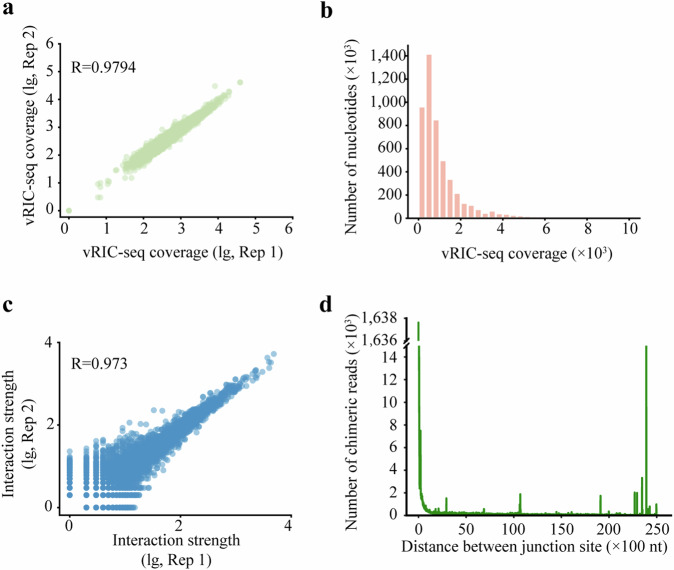
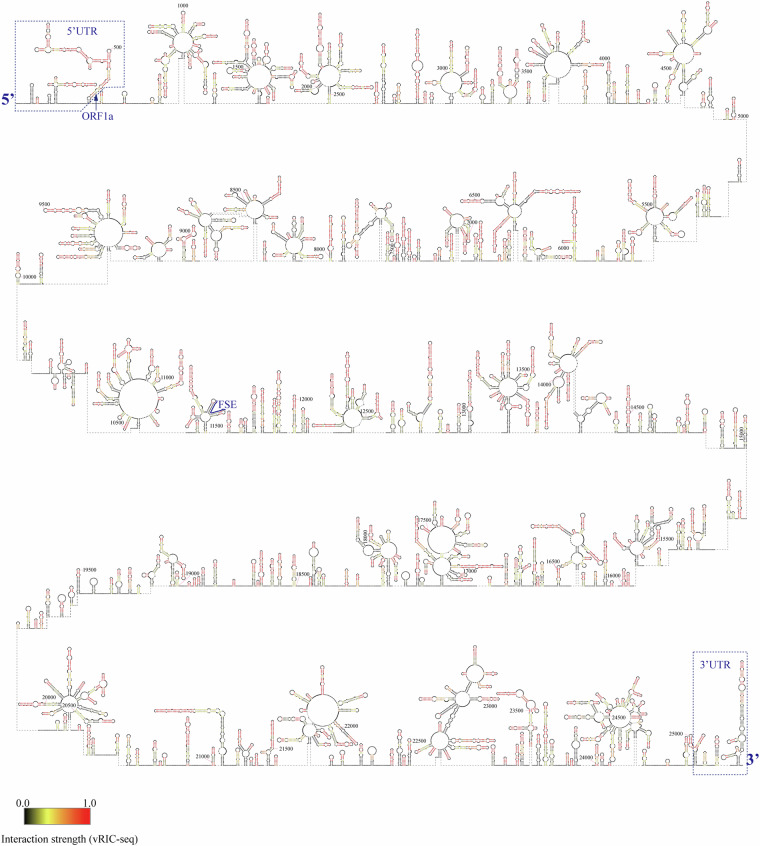
Porcine deltacoronavirus (PDCoV) is a newly emerging and special delta coronavirus, which infect mammals such as pigs, cattle and humans, as well as chickens and birds. Exploring RNA structures in the viral genome benefits the understanding of the role of RNA in the lifecycle of viruses. In this study, vRIC-seq is employed to analyze the RNA-RNA interaction in the whole genome structure of PDCoV in virions. About 12.87 and 13.52 million paired reads are obtained in two biological replicates, respectively, with 17.9% and 14.8% of them are identified as valid chimeric reads. These are employed to predict the RNA secondary structure, which is compact and highly structured. A twisted-cyclized conformation is observed in the RNA-RNA interaction map of PDCoV for the first time. 77 multi-way junctions are evenly distributed in the PDCoV genome. Our work provides fundamental structural insights that are essential for understanding the genomic structure and function, genetic evolution, and packaging characteristics of PDCoV.


Conflict of interest statement

The authors declare no competing interests.

Figures

Fig. 1
Fig. 1
The workflow of vRIC-seq sequencing data analysis.
Fig. 2
Fig. 2
Virus samples and vRIC-seq sequencing data display (a). Electron microscopic images of purified PDCoV particles.(b). The processing of raw data. The green and pink bar charts represented the number of reads in the raw and cleaned FASTQ files, respectively. (c). Distribution of data. Two sets of biological replicates with different colors in the pie and bar charts displayed the proportion of sequencing data aligned to the virus genome, host genome, virus-to-host genome and unmapped reads.
Fig. 3
Fig. 3
Identification of the valid chimeric reads and construction of interaction matrix. (a). The proportion of valid chimeric pairs in all paired reads. The green and pink represented valid chimeric pairs and discard pairs, repectively. Two bar charts represented two sets of biological replicates (b). The percentages of cytosine at the junction of chimeric reads. The horizontal axis used the junction site of all valid chimeric reads as the origin, and statistics were compiled on the percentage of cytosines within the 20 bases before and after the junction site. Two colors represented two sets of biological replicates (c). The coverage of chimeric reads and interaction matrix of two biological replicates. In the heatmap, the shade of color represented the strength of viral RNA interactions.
Fig. 4
Fig. 4
The reliability and feature analysis of the PDCoV genome interactions. (a). Scatter plot showed the correlation for coverage of chimeric reads along the PDCoV genome in two biological replicates (Rep1 and Rep 2). R, Pearson correlation coefficient (b). The coverage of chimeric reads for each nucleotide of the PDCoV genome.The vertical axis represented the number of bases, while the horizontal axis corresponded to the coverage of each base (c). Scatter plots showed the correlation between two biological replicates for the number of chimeric reads (interaction strength). R, Pearson correlation coefficient (d). Distance decay curve of two biological replicates.The horizontal axis represented the distance between interacting RNAs, while the vertical axis represented the number of chimeric reads corresponding to different distances.
Fig. 5
Fig. 5
Whole genome secondary structure of PDCoV. The known structural elements in the 5′UTR, the frame-shifting element (FSE), and the 3′UTR were labeled or marked in blue. The pairwise interaction strength was quantified and showed in different colors.
Fig. 6
Fig. 6
The reliability and feature analysis of the PDCoV genome secondary structure. (a). Distribution of topological domains with differerent lengths. The horizontal axis represented the length of the pseudo structural domain, and the vertical axis represented the number of structural domains with different lengths (b). The minimum free energy of duplexes (n = 30) detected by vRIC-seq were compared with the shuffled control (c). Pairwise interacting RNA fragments (n = 7844) showed more vRIC-seq signals than the random controls that had the same spanning distance (n = 7844) (d). The Venn diagram showed the overlap of double-stranded regions between the two sets of biological replicates. Two colors represented two sets of biological replicates (e). Base-paired RNA content of individual regions (f). Summary of the number of multi-way junctions and the corresponding stems in our secondary structure model.

Similar articles

References

    1. Sun, J. et al. Epidemiology of porcine deltacoronavirus among Chinese pig populations in China: systematic review and meta-analysis. Front Vet Sci.10, 1198593 (2023). - PMC - PubMed
    1. Lednicky, J. A. et al. Independent infections of porcine deltacoronavirus among Haitian children. Nature.600, 133–137 (2021). - PMC - PubMed
    1. Liang, Q. et al. Susceptibility of Chickens to Porcine Deltacoronavirus Infection. Viruses11, 573 (2019). - PMC - PubMed
    1. Jung, K., Hu, H. & Saif, L. J. Calves are susceptible to infection with the newly emerged porcine deltacoronavirus, but not with the swine enteric alphacoronavirus, porcine epidemic diarrhea virus. Arch Virol.16, 2357–2362 (2017). - PMC - PubMed
    1. Szczesniak, I. et al. Structural and Functional RNA Motifs of SARS-CoV-2 and Influenza A Virus as a Target of Viral Inhibitors. Int J Mol Sci.24, 1232 (2023). - PMC - PubMed