. 2024 Oct 14;14(1):24027.
doi: 10.1038/s41598-024-74975-4.

Mycobacterium avium subspecies paratuberculosis (MAP) infection, and its impact on gut microbiome of individuals with multiple sclerosis

Affiliations

Mycobacterium avium subspecies paratuberculosis (MAP) infection, and its impact on gut microbiome of individuals with multiple sclerosis

Hajra Ashraf et al. Sci Rep. .

Abstract

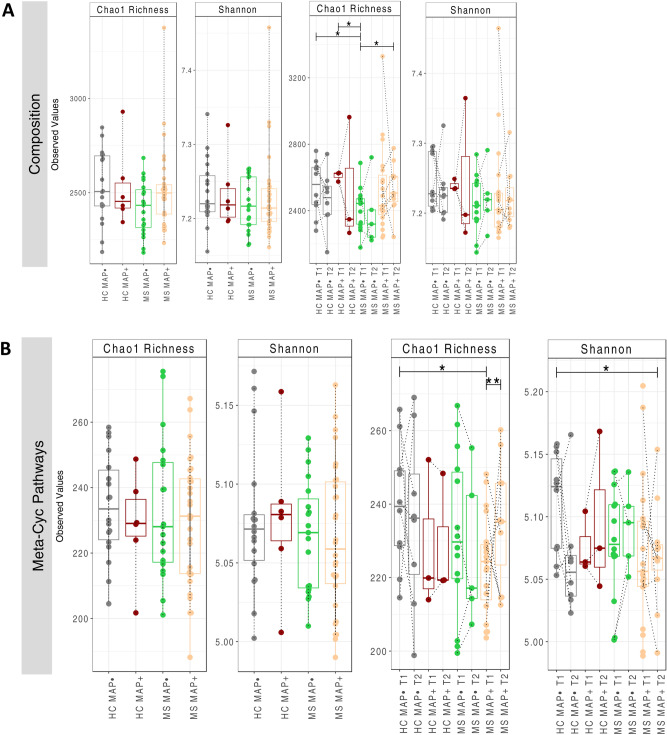
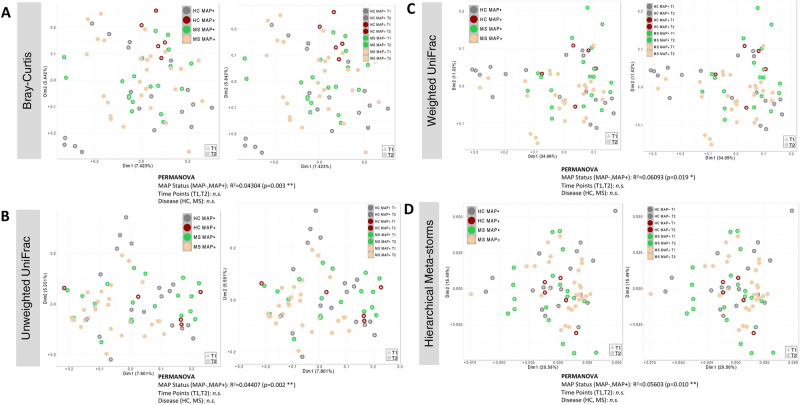
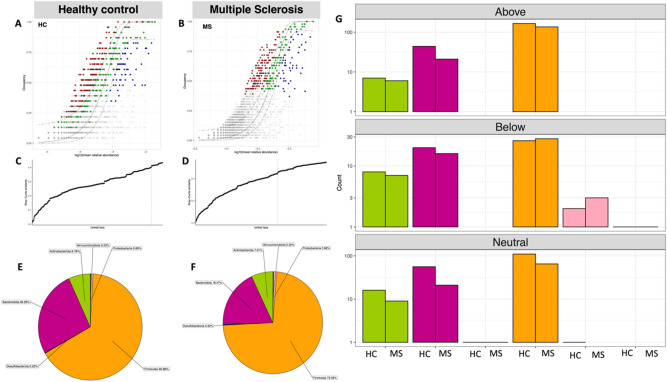
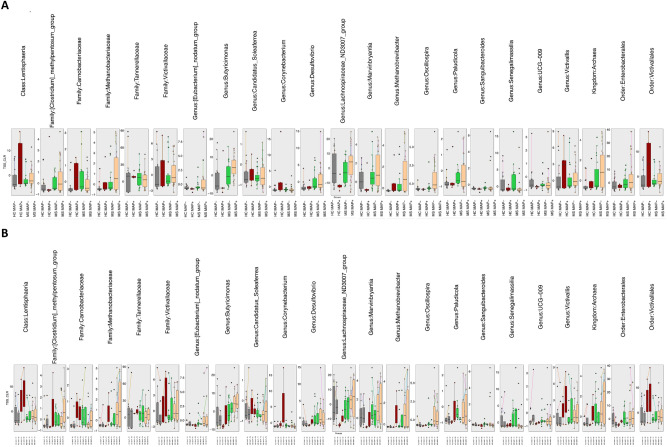
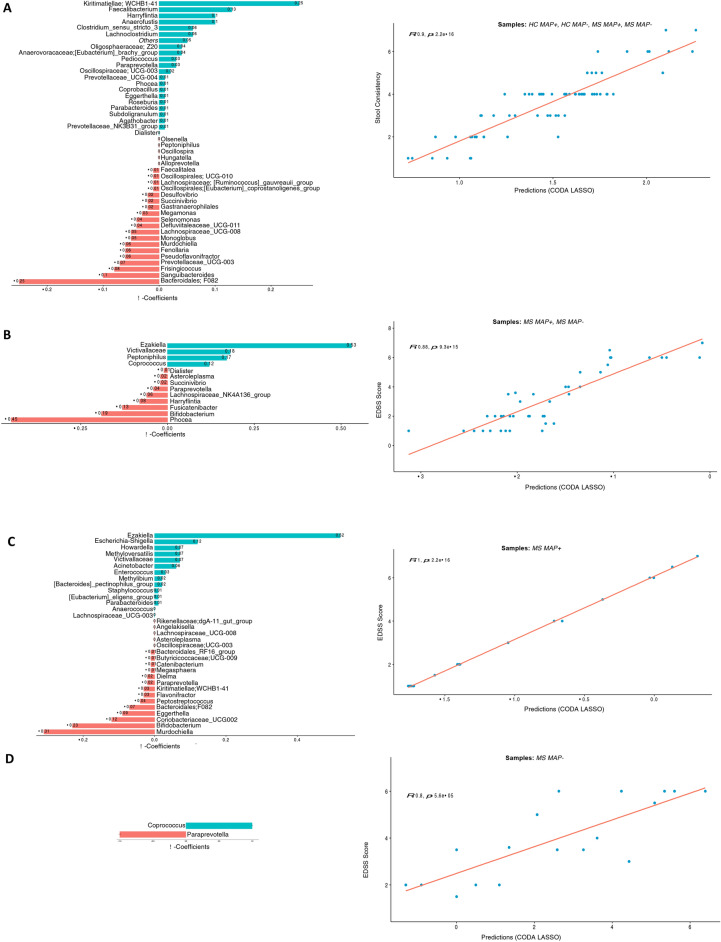
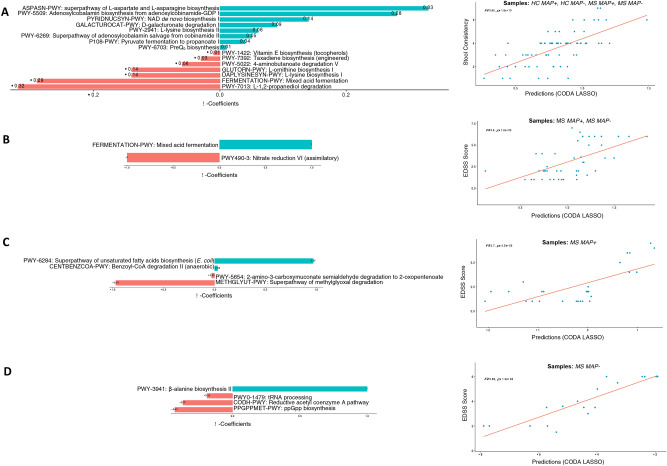
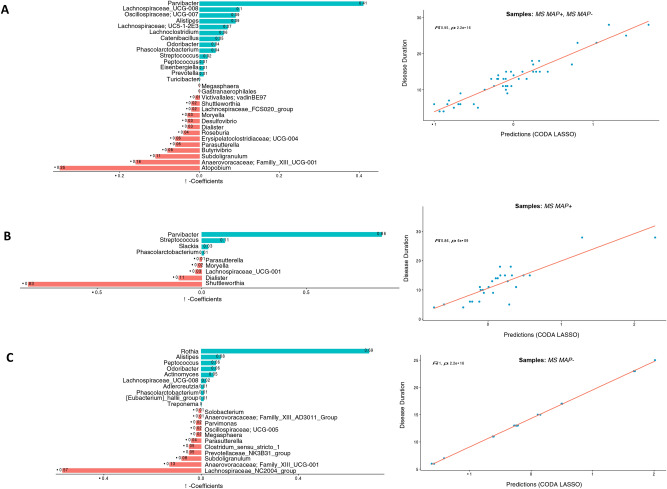
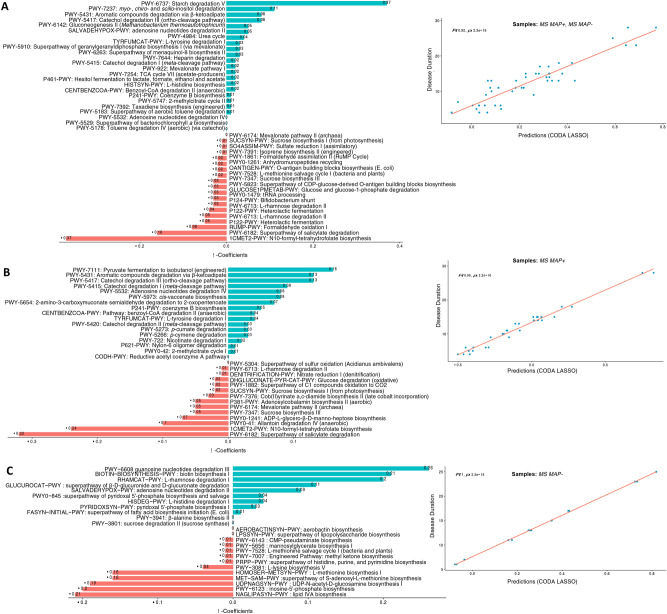
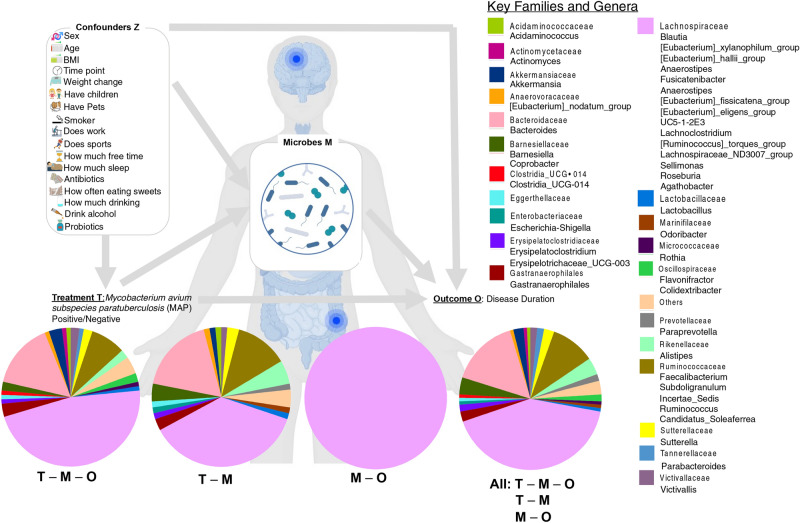
The microbial ecology of Mycobacterium avium subspecies paratuberculosis infections (MAP) within the context of Multiple Sclerosis (MS) is largely an unexplored topic in the literature. Thus, we have characterized the compositional and predicted functional differences of the gut microbiome between MS patients with MAP (MAP+) and without (MAP-) infection. This was done in the context of exposome differences (through self-reported filled questionnaires), principally in anthropometric and sociodemographic patterns to gain an understanding of the gut microbiome dynamics. 16S rRNA microbiome profiling of faecal samples (n = 69) was performed for four groups, which differed by disease and MAP infection: healthy cohort (HC) MAP-; HC MAP+ ; MS MAP-; and MS MAP+ . Using a dynamic strategy, with MAP infection and time of sampling as occupancy models, we have recovered the core microbiome for both HC and MS individuals. Additional application of neutral modeling suggests key genera that are under selection pressure by the hosts. These include members of the phyla Actinobacteriota, Bacteroidota, and Firmicutes. As several subjects provided multiple samples, a Quasi Conditional Association Test that incorporates paired-nature of samples found major differences in Archaea. To consolidate treatment groups, confounders, microbiome, and the disease outcome parameters, a mediation analysis is performed for MS cohort. This highlighted certain genera i.e., Sutterella, Akkermansia, Bacteriodes, Gastranaerophilales, Alistipes, Balutia, Faecalibacterium, Lachnospiraceae, Anaerostipes, Ruminococcaceae, Eggerthellaceae and Clostridia-UCG-014 having mediatory effect using disease duration as an outcome and MAP infection as a treatment group. Our analyses indicate that the gut microbiome may be an important target for dietary and lifestyle intervention in MS patients with and without MAP infection.

Keywords: Gut microbiome; 16S rRNA; Mediation analysis; Neutral modelling; Multiple sclerosis.


Conflict of interest statement

PD is employed by BIOMES NGS GmbH. The remaining authors declare that the research was conducted in the absence of any commercial or financial relationships that could be construed as a potential conflict of interest.

Figures

Fig. 1
Fig. 1
Alpha diversity (Chao 1 Richness and Shannon entropy) comparison of (A) bacterial OTUs, and the (B) MetaCyc pathways predicted from the PICRUSt2 software. Going from left to right, different resolution is considered, i.e., where samples are merged based on time (left panels) and where they are not (right panels). The lines connect samples according to simple ANOVA (left panels) or One-way within ANOVA incorporating paired nature of samples coming from the same subjects (right panels), and where significant are connected with solid lines with significance values as: *p < 0.05, **p < 0.01, or ***p < 0.001. The dotted lines connect two samples when they originate from the same subject.
Fig. 2
Fig. 2
Beta diversity represented by principal coordinate analysis (PCoA) plots with each axis showing the percentage variability explained by that axis, and where ellipses represent 95% confidence interval of the standard error for a given group. We have used four different distance measures: (A) Bray–Curtis distance to show differences in composition, (B) Unweighted UniFrac distance to show differences in phylogeny, (C) Weighted UniFrac to show differences in both composition and phylogeny, (D) Hierarchical Meta-storms to show differences in metabolic function. PERMANOVA statistics utilising these distance measures are shown underneath to suggest if there are significant differences between the groups with R2 value showing percentage variability explained. Similar to Fig. 1, we have used two different resolutions: merged time points (left panels), and time points taken separately (right panels).
Fig. 3
Fig. 3
Core microbiome (red, green and blue points) identified through a dynamic strategy for (A) HC and (B) MS samples. We have used four occupancies in both models (MAP− T1; MAP− T2, MAP+ T1, and MAP+ T2). To identify the thresholds for core microbiome, shown below the abundance-occupancy diagrams for (C) HC and (D) MS samples, we calculate the function C (that implicitly incorporates explanatory power of the chosen core subset in terms of capturing beta diversity). The dotted lines represent the “last 2% decrease” criteria where OTUs are incorporated in the core subset until there is no more than 2% decrease in beta diversity. Independently, a neutral model is fitted with those OTUs that fall within the 95% interval confidence intervals shown in green, whilst non-neutral OTUs with observed frequency above the predicted frequency from the neutral model (selected by the host) are shown in red colours, and those with observed frequency below the predicted frequency from the neutral model (selected by dispersal limitation) are shown in green colours. The proportion of core OTUs belonging to different phyla are shown with a pie chart for (E) HC and (F) MS samples whilst the count of neutral/non-neutral OTUs (G) are shown with the bar plots.
Fig. 4
Fig. 4
Subset of taxa (at different lineages, Kingdom, Phylum, Class, Order, Family, Genus) returned from QCAT-C association test that are differentially abundant between the cohorts considered in this study, where (A) merges samples from time points T1 and T2 together, and (B) considers them separately. The QCAT-C association test that takes into account paired nature of samples i.e., originating from the same subject, and are connected by lines. The values represent the TSS+ CLR normalized abundances of individual taxa. The global P-value is the test associated with the collective subset returned as significantly different, whilst the local P-values < 0.05 (not shown here) for all features.
Fig. 5
Fig. 5
Two disjoint sets of β- coefficients for OTUs collated at genus level, with those that are positively associated are shown in green, whilst those that are negatively associated are shown in red. These are returned from apply the CODA-LASSO procedure using the following outcomes: (A) Stool Consistency (for HC, MAP + , and MAP − samples) (B) EDSS Score (for MAP + , and MAP − samples) (C) EDSS Score (for MAP + samples only), and (D) EDSS Score (for MAP − samples only). The prediction accuracy with R value as a quality of fit criteria, is shown on the right side and shows good agreement between the prediction obtained through the models and the true values.
Fig. 6
Fig. 6
Two disjoint sets of β- coefficients for MetaCyc pathways, with those that are positively associated are shown in green, whilst those that are negatively associated are shown in red. These are returned from apply the CODA-LASSO procedure using the following outcomes: (A) Stool Consistency (for HC, MAP + , and MAP − samples) (B) EDSS Score (for MAP + , and MAP − samples) (C) EDSS Score (for MAP + samples only), and (D) EDSS Score (for MAP − samples only). The prediction accuracy with R value as a quality of fit criteria, is shown on the right side and shows good agreement between the prediction obtained through the models and the true values.
Fig. 7
Fig. 7
Two disjoint sets of β- coefficients for OTUs collated at genus level, with those that are positively associated are shown in green, whilst those that are negatively associated are shown in red. These are returned from apply the CODA-LASSO procedure using the following outcomes: (A) Disease Duration (for MAP + , and MAP − samples) (B) Disease Duration (for MAP + samples only), and (C) Disease Duration (for MAP − samples only). The prediction accuracy with R value as a quality of fit criteria, is shown on the right side and shows good agreement between the prediction obtained through the models and the true values.
Fig. 8
Fig. 8
Two disjoint sets of β- coefficients for MetaCyc pathways, with those that are positively associated are shown in green, whilst those that are negatively associated are shown in red. These are returned from apply the CODA-LASSO procedure using the following outcomes: (A) Disease Duration (for MAP + , and MAP − samples) (B) Disease Duration (for MAP + samples only), and (C) Disease Duration (for MAP − samples only). The prediction accuracy with R value as a quality of fit criteria, is shown on the right side and shows good agreement between the prediction obtained through the models and the true values.
Fig. 9
Fig. 9
Summary statistics of OTUs playing a mediation role between T (MAP − /MAP +) and outcome (disease duration), and coloured according to their taxonomic assignment at Family level, and based on Supplementary Table S16 . The four pie charts represent: T – M – O tripartite relationship with T – M Q-value ≤ 0.05 and M–O Q-value ≤ 0.05; T-M bivariate relationship with T – M Q-value ≤ 0.05 and M–O Q-value > 0.05; M–O bivariate relationship with T – M Q-value > 0.05 and M–O Q-value ≤ 0.05; and all relationship with T – M Q-value ≤ 0.05 or M–O Q-value ≤ 0.05. The pie chart then represents the proportional representation of families within these types of relationship. The model also takes into account confounders Z shown on top left.

Similar articles

References

    1. Walton, C. et al. Rising prevalence of multiple sclerosis worldwide: Insights from the Atlas of MS. Mult. Scler. J. 26(14), 1816–1821 (2020). - PMC - PubMed
    1. WHO. Multiple sclerosis: World Health Organization. https://www.who.int/news-room/fact-sheets/detail/multiple-sclerosis (2023).
    1. Olsson, T., Barcellos, L. F. & Alfredsson, L. Interactions between genetic, lifestyle and environmental risk factors for multiple sclerosis. Nat. Rev. Neurol. 13(1), 25–36 (2017). - PubMed
    1. Ekundayo, T. C. et al. Systematic review and meta-analysis of Mycobacterium avium subsp. paratuberculosis as environmental trigger of multiple sclerosis. Mult. Scler. Relat. Disord. 59, 103671 (2022). - PubMed
    1. Hayashi, F. et al. Elevated mycobacterium avium subsp paratuberculosis (MAP) antibody titer in Japanese multiple sclerosis. J. Neuroimmunol. 360, 577701 (2021). - PubMed

Substances