. 2024 Nov;16(11):2795-2826.
doi: 10.1038/s44321-024-00151-w. Epub 2024 Oct 14.

Unraveling autophagic imbalances and therapeutic insights in Mecp2-deficient models

Affiliations

Unraveling autophagic imbalances and therapeutic insights in Mecp2-deficient models

Alessandro Esposito et al. EMBO Mol Med. 2024 Nov.

Abstract

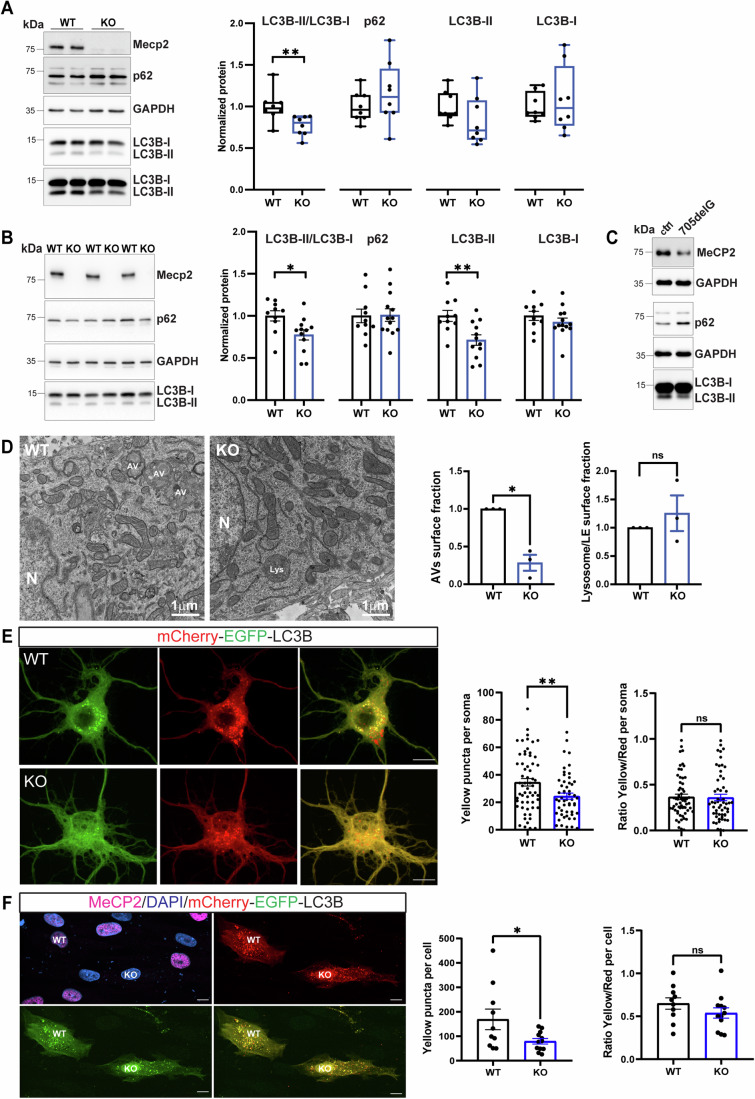
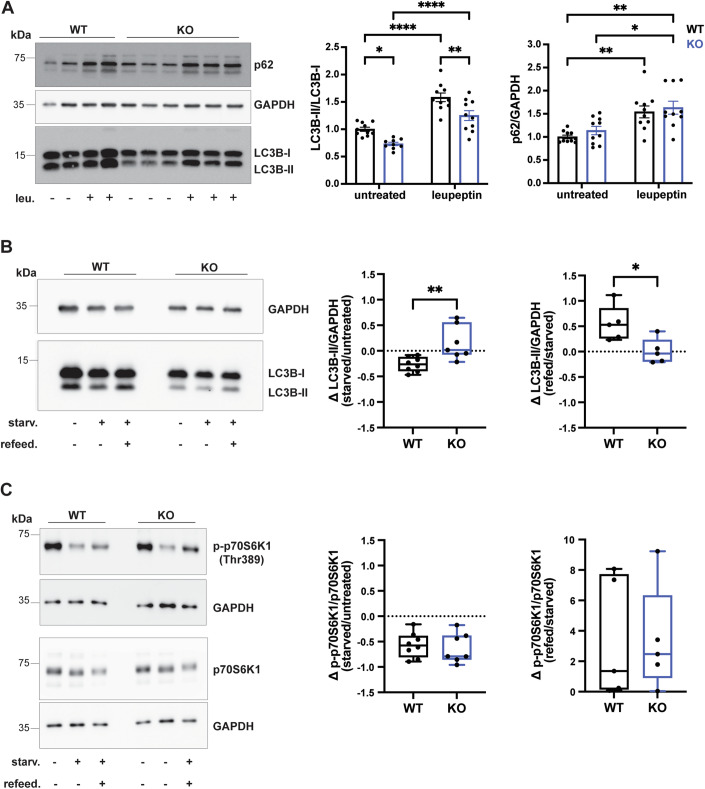
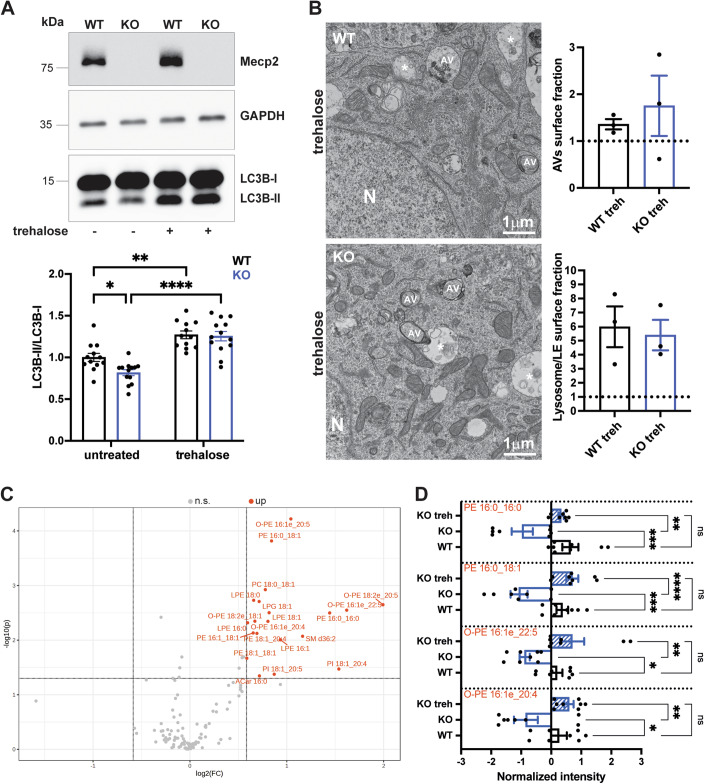
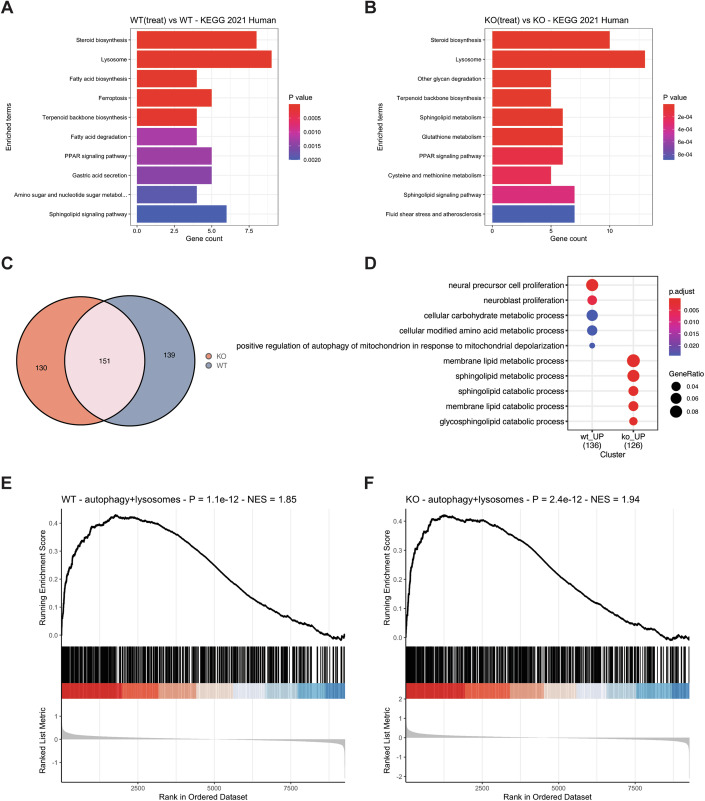
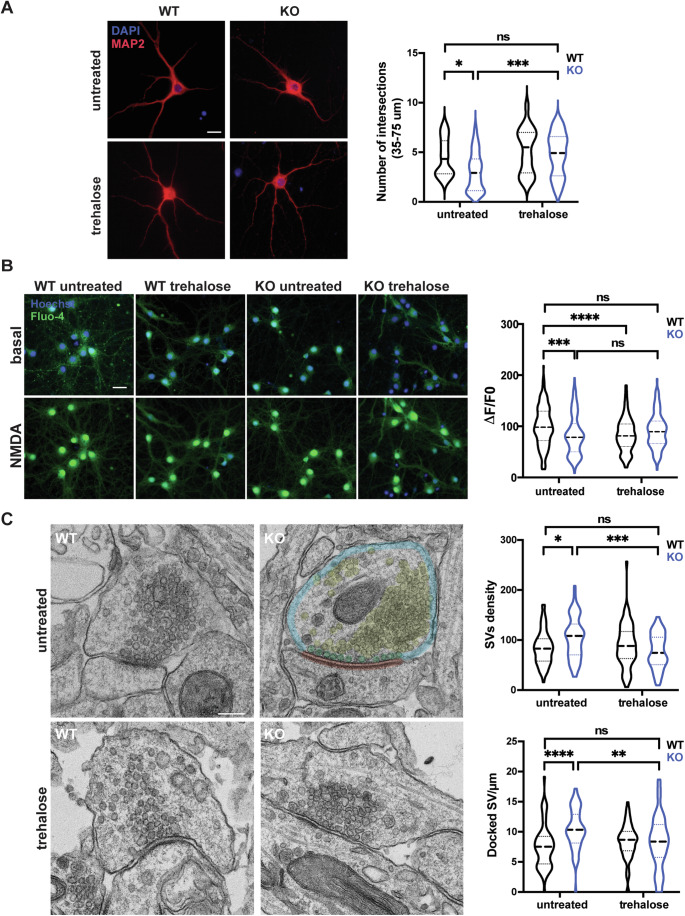
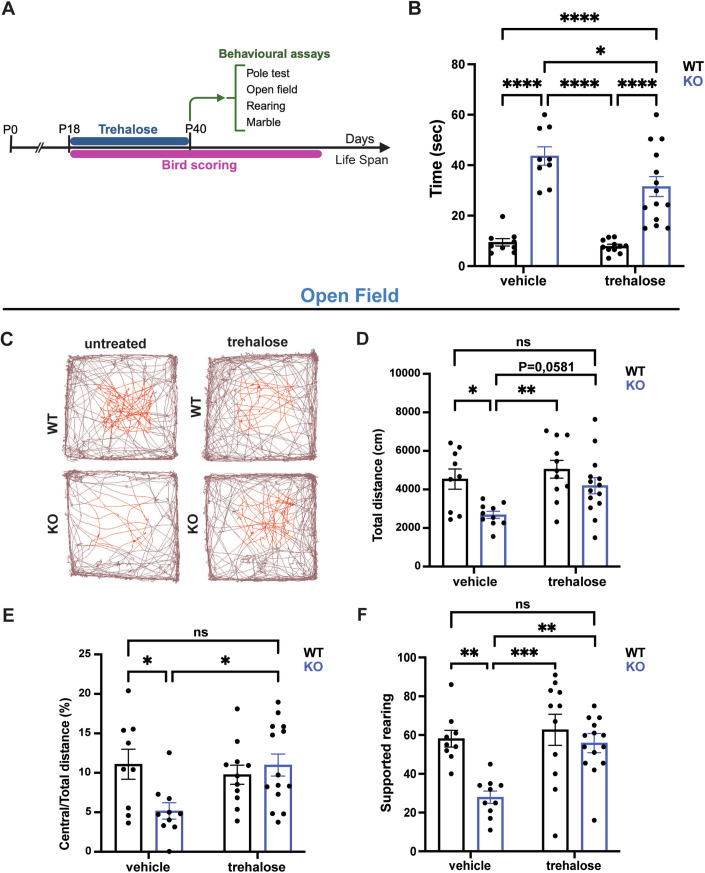
Loss-of-function mutations in MECP2 are associated to Rett syndrome (RTT), a severe neurodevelopmental disease. Mainly working as a transcriptional regulator, MeCP2 absence leads to gene expression perturbations resulting in deficits of synaptic function and neuronal activity. In addition, RTT patients and mouse models suffer from a complex metabolic syndrome, suggesting that related cellular pathways might contribute to neuropathogenesis. Along this line, autophagy is critical in sustaining developing neuron homeostasis by breaking down dysfunctional proteins, lipids, and organelles.Here, we investigated the autophagic pathway in RTT and found reduced content of autophagic vacuoles in Mecp2 knock-out neurons. This correlates with defective lipidation of LC3B, probably caused by a deficiency of the autophagic membrane lipid phosphatidylethanolamine. The administration of the autophagy inducer trehalose recovers LC3B lipidation, autophagosomes content in knock-out neurons, and ameliorates their morphology, neuronal activity and synaptic ultrastructure. Moreover, we provide evidence for attenuation of motor and exploratory impairment in Mecp2 knock-out mice upon trehalose administration. Overall, our findings open new perspectives for neurodevelopmental disorders therapies based on the concept of autophagy modulation.

Keywords: Autophagy; MeCP2; Metabolism; Neurons; Rett Syndrome.


Conflict of interest statement

Disclosure and competing interests statement The authors declare no competing interests.

Figures

Figure 1
Figure 1. Mecp2 deficiency leads to a reduction in LC3-II levels in vitro and in vivo.
(A) Representative western blot from lysates of WT and KO cortical neurons (14 days in culture, DIV). p62, LC3B-I, and LC3B-II intensities were quantified by densitometric analysis and normalized on GAPDH intensity. LC3B-II/LC3B-I ratio was also calculated. Mecp2 signal is shown as a genotype control. Data were expressed as median ± min/max, normalized on WT (n = 8 embryos from three independent experiments). Mann–Whitney test, **p < 0.01 (LC3B-II/LC3B-I: p = 0.003; p62: p = 0.2786; LC3B-II: p = 0.1605; LC3B-I: p = 0.9591). (B) Protein expression analysis from cortices of WT and KO mice at P5 are shown. The band densities of LC3B-I-II, and p62 are quantified and normalized over GAPDH. Data were expressed as mean ± SEM normalized on WT (n = 9 WT mice; n = 12 KO mice). Unpaired t-test with Welch’s correction, *p < 0.05, **p < 0.01 (LC3B-II/LC3B-I p = 0.0165, p62/GAPDH p = 0.9318, LC3B-II/GAPDH p = 0.0048, LC3B-I/GAPDH p = 0.3241). Outlier was identified with GRUBBS’s test and removed from the analysis. (C) Western blot analysis was performed on primary fibroblast lysates from an RTT patient carrying a mutation in MECP2 (c.705delG; p.E235fs) and a healthy control (ctrl). MeCP2 expression levels, as well as p62, LC3B-I and LC3B-II, are shown. GAPDH was used as a loading control (n = 1 experiment). (D) Representative TEM micrographs of WT and KO cortical neurons (14 DIV) under resting conditions. The area occupied by autophagosomes and autolysosomes (AVs) or by lysosomes over the total cell area in the image was quantified. Data were expressed as mean ± SEM (n = 3 independent experiments, with 59 WT and 60 KO neurons analyzed). Unpaired t-test with Welch’s correction, *p < 0.05 (AVs p = 0.0212; Lysosomes p = 0.5013). N nucleus, AV autophagosome, Lys lysosome. (E) Representative images of WT and KO cortical neurons (14 DIV) transfected with the mCherry-EGFP-LC3 construct. The total number of yellow dots in the cell soma and the ratio of yellow/red dots were quantified. Data were expressed as mean ± SEM (n = 4 independent experiments, with 60 WT and 53 KO neurons analyzed). Unpaired t-test with Welch’s correction, **p < 0.01 (Yellow puncta per soma: p = 0.0053, Ratio Yellow/Red per soma: p = 0.8946). (F) Representative images of RTT patients’ fibroblast transfected with the mCherry-EGFP-LC3 plasmid. The total number of yellow puncta and the yellow/red dots ratio were quantified. Data were expressed as mean ± SEM (n = 2 independent experiments, with 10 WT and 12 KO analyzed fibroblasts). Unpaired t-test, *p < 0.05 (Yellow puncta per cell: p = 0.0370, Ratio Yellow/Red per cell: p = 0.2336). Source data are available online for this figure.
Figure 2
Figure 2. LC3B-II low levels do not depend on a defect in the nutrient-sensing ability of Mecp2 KO neurons.
(A) Representative western blot from lysates of WT and KO cortical neurons (14 DIV) under resting condition or incubated with 20 µM leupeptin for 24 h. p62, LC3B-I, and LC3B-II intensities were quantified by densitometric analysis. LC3B-II/LC3B-I ratio was calculated, and the p62 level was normalized on GAPDH intensity. Data were expressed as mean ± SEM, normalized on WT untreated (n = 9–10 embryos from four independent experiments). Two-way ANOVA with Tukey’s multiple comparisons test, *p < 0.05, **p < 0.01, ****p < 0.0001 (LC3B-II/I: ut WT vs ut KO p = 0.0355, ut WT vs leu WT p < 0.0001, ut WT vs leu KO p = 0.0507, ut KO vs leu WT p < 0.0001, ut KO vs leu KO p < 0.0001, leu WT vs leu KO p = 0.0047; p62/GAPDH: ut WT vs ut KO p = 0.7996, ut WT vs leu WT p = 0.0055, ut WT vs leu KO p = 0.0010, ut KO vs leu WT p = 0.0545, ut KO vs leu KO p = 0.0126, leu WT vs leu KO p = 0.9313). (B) Representative western blot from lysates of WT and KO cortical neurons (14 DIV) under resting condition (untreated), withdrawal of amino acids (starvation), and subsequent recovery by replacement of starvation medium with normal cell growth medium (refeeding). LC3B-II intensity was quantified by densitometric analysis and normalized on GAPDH intensity and on WT untreated. The fold change (delta, Δ) of LC3B-II intensity was then calculated as (starvation-untreated)/untreated or (refeeding-starvation)/starvation. Data were expressed as median ± min/max (n = 5–8 embryos from five independent experiments). Mann–Whitney test, *p < 0.05, **p < 0.01 (Δ LC3B-II starved/ut: p = 0.0022; Δ LC3B-II refed/ut: p = 0.0317). (C) Representative western blot from lysates of WT and KO cortical neurons (14 DIV) under resting condition (untreated), starvation and refeeding conditions as in (B). p70S6K1 and p-p70S6K1 (Thr389) intensities were quantified by densitometric analysis and normalized on GAPDH intensity and on WT untreated. The fold change (delta, Δ) of p-p70S6K1/p70S6K1 ratio was then calculated as (starvation-untreated)/untreated or (refeeding-starvation)/starvation. Data were expressed as median ± min/max (n = 5–8 embryos from five independent experiments). Mann–Whitney test, ns (Δ p-p70S6K1 starved/ut: p = 0.6943; Δ p-p70S6K1 refed/ut: p = 0.8413). Source data are available online for this figure.
Figure 3
Figure 3. Mecp2 KO neurons show defects in the levels of ATG16L1α and of phosphatidylethanolamine.
(A) Representative western blot from lysates of WT and KO cortical neurons (14 DIV). ATG3, ATG5, ATG16L1α, and ATG16L1β intensities were quantified by densitometric analysis and normalized on GAPDH intensity. Data were median ± min/max, normalized on WT (n = 4–6 embryos from two independent experiments). Mann–Whitney test, *p < 0.05 (ATG3 p = 0.5887; ATG5 p = 0.3939; ATG16L1β p = 0.4857; ATG16L1α p = 0.0286). (B) Volcano Plot comparing WT vs KO cortical neurons lipidoms. Equal variance (unpaired) two tails t-test, threshold set to p < 0.05 and fold change >1.5 (blue: lipids downregulated in KO; red: lipids upregulated in KO; PE: diacylglycerophosphoethanolamines; O-PE: alkyl, acylglycerophosphoethanolamines; PS: diacylglycerophosphoserines; PG: diacylglycerophosphoglycerols; SM: Ceramide phosphocholines/sphingomyelins; PC: glycerophosphocholines). Source data are available online for this figure.
Figure 4
Figure 4. Trehalose treatment restores the autophagosome biogenesis in Mecp2 KO neurons.
(A) Representative western blot from lysates of WT and KO cortical neurons (14 DIV) under resting condition or incubated with 25 mM trehalose for 48 h. LC3B-I and LC3B-II intensities were quantified by densitometric analysis. LC3B-II/LC3B-I ratio was calculated. Mecp2 signal is shown as a genotype control. GAPDH was used as a loading control. Data were expressed as mean ± SEM (n = 12–13 embryos from five independent experiments). Two-way ANOVA with Tukey’s multiple comparisons test, *p < 0.05, **p < 0.01, ****p < 0.0001 (LC3B-II/I: ut WT vs ut KO p = 0.0437, ut WT vs treh WT p = 0.0015, ut WT vs treh KO p = 0.0024, ut KO vs treh WT p < 0.0001, ut KO vs treh KO p < 0.0001, treh WT vs treh KO p = 0.9957). (B) Representative TEM micrographs of WT and KO cortical neurons (14 DIV) incubated with trehalose for 48 h. The area occupied by autophagosomes and autolysosomes (AVs) or by lysosomes over the total cell area in the image was quantified. Data were expressed as mean ± SEM normalized on WT untreated (data shown in Fig. 1E, dashed line on the graph) (n = 3 independent experiments, with 58 WT and 61 KO treh-treated neurons analyzed). N nucleus, AV autophagosome, *=enlarged lysosomes. (C) Volcano plot comparing KO vs KO treated cortical neurons lipidoms. Equal variance (unpaired) two tails t-test, a threshold set to p < 0.05 and fold change >1.5 (red: lipids upregulated in KO treh; PE: diacylglycerophosphoethanolamines; O-PE: alkyl, acylglycerophosphoethanolamines; PS: diacylglycerophosphoserines; LPG: monoacylglycerophosphoglycerols; SM: ceramide phosphocholines/sphingomyelins; PC: diacylglycerophosphocholines; ACar: acetylcarnitines; LPE: diacylglycerophosphoethanolamines; PI: diacylglycerophosphoinositols). (D) Boxplot of selected lipids are shown. Data were expressed as mean ± SEM (n = 4 embryos with two technical replicates, from three independent experiments). One-way ANOVA followed by Tukey’s multiple comparison test, *p < 0.05, **p < 0.01, ***p < 0.001, ****p < 0.0001 (PE 16:0_16:0: WT vs KO p = 0.0008, WT vs KO treh p = 0.6862, KO vs KO treh p = 0.0058; PE 16:0_18:1: WT vs KO p = 0.0006, WT vs KO treh p = 0.5680, KO vs KO treh p < 0.0001; O-PE 16:1e_22:5: WT vs KO p = 0.03, WT vs KO treh p = 0.4042, KO vs KO treh p = 0.0015; O-PE 16:1e_20:4: WT vs KO p = 0.0347, WT vs KO treh p = 0.6949, KO vs KO treh p = 0.0056). Source data are available online for this figure.
Figure 5
Figure 5. Trehalose- mediated autophagy enhancement upregulates lipid metabolism.
(A, B) Enriched categories of upregulated genes upon trehalose administration with at least 0.25 log2fold change in expression levels in WT (A) and KO (B) neurons compared to untreated control. The vertical axis shows the top ten KEGG terms while the horizontal axis displays the gene counts belonging to each category. The analysis demonstrated that the majority of enriched processes were related to lipid-metabolic function in both genotypes. The p value was computed using Fisher’s exact test. (C) Venn Diagram indicating the number of genes found upregulated in WT, KO, or both. (D) GO of genes upregulated either in WT or KO neurons upon trehalose treatment. The p value was computed using the hypergeometric test. The adjusted p value is obtained using the Benjamini–Hochberg method for correction for multiple hypotheses testing. (E, F) GSEA of transcriptomic changes following trehalose administration in WT (left) and KO (right) neurons related to autophagy-lysosomal genes. The y-axis represents the enrichment score (ES) while the vertical black lines on the x-axis represent the autophagy-lysosomal genes. The colored band at the bottom shows the ranked gene expression of RNA-seq data (left, red: upregulated; right, blue: downregulated) and the degree of correlation with autophagy-lysosomal genes. The significance threshold was set at FDR <0.05 and statistical analysis was computed according to Subramanian et al, . Source data are available online for this figure.
Figure 6
Figure 6. Trehalose treatment improves morphological and functional alterations observed in Mecp2 KO neurons.
(A) Representative images of MAP2 positive WT and KO primary cortical neurons (6 DIV) treated or not with trehalose (50 mM for 48 h) and morphologically analyzed with the Sholl analysis plugin. Scale bar: 20 μm. The number of intersections in the range of 35–75 μm from soma is quantified. Two-way ANOVA followed by Tukey’s multiple comparisons test, *p < 0.05, ***p < 0.001 (ut WT vs ut KO p = 0.0173, ut WT vs treh WT p = 0.4588, ut WT vs treh KO p = 0.8563, ut KO vs treh WT p < 0.00001, ut KO vs treh KO p = 0.0005, treh WT vs treh KO p = 0.8879). (B) Representative images of WT and KO primary cortical neurons (14 DIV) loaded with Fluo-4, before and after exposure to 100 µM NMDA. Scale bar: 40 µm. Data indicate the Fluo-4 intensity (ΔF/F0) of WT and KO treated neurons and their relative controls (violin plots, median ± quartiles; n = 216 cells for WT untreated, n = 123 cells for KO untreated, n = 236 cells for WT treated, n = 141 cells for KO treated from three independent experiments). Two-way ANOVA followed by Tukey’s multiple comparisons test, ***p < 0.001, ****p < 0.0001 (ut WT vs ut KO p = 0.0002, ut WT vs treh WT p < 0.0001, ut WT vs treh KO p = 0.1083, ut KO vs treh WT p = 0.9982, ut KO vs treh KO p = 0.2632, treh WT vs treh KO p = 0.2152). (C) Representative TEM images of synaptic terminals from WT and KO cortical neurons (14 DIV) under resting conditions or incubated with 25 mM trehalose for 48 h. The area of the presynaptic terminal (blue), the number of synaptic vesicles (SVs, yellow), the number of docked SVs (green), and the length of the active zone (AZ, red) were quantified. The density of SVs in the terminal and the density of SVs docked to the active zone are shown. Scale bar: 200 nm. Data were expressed as violin plots, median ± quartiles (n > 60 cells analyzed/condition for each experiment, from three independent experiments). Two-way ANOVA followed by Tukey’s multiple comparisons tests, *p < 0.05, **p < 0.01, ***p < 0.001, ****p < 0.0001 (SVs density: ut WT vs ut KO p = 0.0184, ut WT vs treh WT p = 0.8142, ut WT vs treh KO p = 0.8073, ut KO vs treh WT p = 0.1577, ut KO vs treh KO p = 0.0008, treh WT vs treh KO p = 0.2784; Docked SV/µm: ut WT vs ut KO p < 0.0001, ut WT vs treh WT p = 0.5949, ut WT vs treh KO p = 0.7447, nt KO vs treh WT p = 0.0073, ut KO vs treh KO p = 0.0031, treh WT vs treh KO p = 0.9947). Source data are available online for this figure.
Figure 7
Figure 7. Trehalose administration ameliorates locomotor and exploratory ability of Mecp2 KO mice.
(A) Experimental timeline and outcome measurements. (B) Pole test assay measuring the movement coordination. (CE) Open field assessment of locomotion and exploratory activity. (C) Mice traces in the arena. (D) Total distance and (E) central/total distance measurements. (F) Supported rearing evaluation. Bars represent mean values with ± SEM. For behavioral analysis n = 9 WT vehicle, 10 = KO vehicle (9 = KO vehicle in Pole test), 11 = WT trehalose, 14 = KO trehalose. Behavioral data were analyzed using two-way ANOVA followed by Tukey’s multiple comparisons test *p < 0.05, **p < 0.01, ***p < 0.001, ****p < 0.0001 (Pole test: ut WT vs ut KO p < 0.0001, ut WT vs treh WT p = 0.9860, ut WT vs treh KO p < 0.0001, ut KO vs treh WT p < 0.0001, ut KO vs treh KO p = 0.0390, treh WT vs treh KO p < 0.0001; Total distance: ut WT vs ut KO p = 0.0308, ut WT vs treh WT p = 0.8503, ut WT vs treh KO p = 0.9415, ut KO vs treh WT p = 0.0022, ut KO vs treh KO p = 0.0581, treh WT vs treh KO p = 0.4460; Central/Total distance: ut WT vs ut KO p = 0.0417, ut WT vs treh WT p = 0.9226, ut WT vs treh KO p > 0.9999, ut KO vs treh WT p = 0.1262, ut KO vs treh KO p = 0.0226, treh WT vs treh KO p = 0.9165; Supported rearing: ut WT vs ut KO p = 0.0044, ut WT vs treh WT p = 0.9407, ut WT vs treh KO p = 0.9920, ut KO vs treh WT p = 0.0005, ut KO vs treh KO p = 0.0058, treh WT vs treh KO p = 0.8062). Source data are available online for this figure.
Figure EV1
Figure EV1. Mecp2 deficiency leads to a defective autophagosome maturation.
(A) Representative western blot from lysates of WT and KO cortical neurons at different days in culture (DIV). LC3B-I and LC3B-II intensities were quantified by densitometric analysis. LC3B-II/LC3B-I ratio was calculated. Mecp2 signal is shown as a genotype control. Data were expressed as median ± min/max (n = 5 embryos from three independent experiments). Mann–Whitney test, *p < 0.05 (3 DIV p = 0.8413; 7 DIV p > 0.99; 14 DIV p = 0.0159; 21 DIV p = 0.0556). (B) Western blot from lysates of WT and KO cortical neurons at different days in culture (DIV). NeuN, PSD-95, SNAP25, and VAMP2 signals are shown as markers of developmental progression (n = 1). (C) Representative TEM micrographs of WT and KO cortical neurons (14 DIV) under resting conditions showing examples of autophagic vacuoles in WT neurons, and the presence of immature autophagic structures in neuronal processes in KO neurons. (D) Representative western blot from lysates of WT and KO cortical neurons (14 DIV). VGLUT1 intensity was quantified by densitometric analysis and normalized on GAPDH intensity. Data were expressed as median ± min/max, normalized on WT (n = 6 embryos from three independent experiments). Mann–Whitney test, **p < 0.01 (p = 0.0022).
Figure EV2
Figure EV2. ATG16L1 and lipid content of WT and KO treated and untreated neurons.
(A) Heatmap obtained using the 30 most significant lipids in the complete dataset (ANOVA test). Clustering distance measure: Euclidean. Clustering method for lipids was Ward. PE: diacylglycerophosphoethanolamines; O-PE: alkyl, acylglycerophosphoethanolamines; PS: diacylglycerophosphoserines; PI: diacylglycerophosphoinositols; PC: diacylglycerophosphocholines; SM: ceramide phosphocholines (sphingomyelins); LPG: monoacylglycerophosphoglycerols; LPE: diacylglycerophosphoethanolamines; LPS: monoacylglycerophosphoserines; LPC: monoacylglycerophosphocholines. (B) Representative western blot from lysates of WT and KO cortical neurons (14 DIV) under resting condition or incubated with 25 mM trehalose for 48 h. ATG16L1α and ATG16L1β intensies were quantified by densitometric analysis and normalized on GAPDH intensity. Data were mean ± SEM, normalized on WT (n = 12–13 embryos from five independent experiments). Two-way ANOVA with Tukey’s multiple comparisons test, *p < 0.05, **p < 0.01 (ATG16L1α: ut WT vs ut KO p = 0.0092, ut WT vs treh WT p = 0.7545, ut WT vs treh KO p = 0.3637, ut KO vs treh WT p = 0.0191, ut KO vs treh KO p = 0.7545, treh WT vs treh KO p = 0.0092).
Figure EV3
Figure EV3. Trehalose administration induces transcriptional changes related to lipidic and auto-lysosomal pathways along with TFEB nuclear translocation.
(A) Principal component analysis (PCA) plot of WT and KO neurons untreated or treated with trehalose. Percentage of variance is reported for both PC1 (first component) and PC2 (second component). (B, C) Volcano plot showing the upregulated (red dots) and downregulated (blue dots) DEGs of WT treh vs WT (left) and KO treh vs KO (right) neurons. The x-axis represents the log2 fold change (FC), while the y-axis is the −log 10 (P adj) of RNA-seq data from eight independent biological replicates. The p value was computed using DESeq2 (see Methods). The adjusted p value is obtained using the Benjamini–Hochberg method for correction for multiple hypotheses testing. Differentially expressed genes were assessed using the adjusted p value threshold of 0.05. (D) Representative confocal images of WT and KO cortical neurons (14 DIV) transfected with a TFEB-EGFP plasmid, under resting conditions or incubated with 25 mM trehalose for 48 h (treh). GFP immunolabelling and Hoechst nuclear stain are shown. Results are expressed as percentage of cells assigned to each subcellular localization category (either only nuclear, only cytosolic, or nuclear + cytosolic), mean ± SEM (n > 10 cells analyzed/condition for each experiment, from 3 to 4 independent experiments); Scale bar: 10 µm.
Figure EV4
Figure EV4. Rapamycin enhances autophagic vacuole content and neuronal activity in Mecp2 KO neurons.
(A) Representative TEM micrographs of WT and KO cortical neurons (14 DIV) incubated with 100 nM rapamycin for 48 h. The area occupied by autophagosomes and autolysosomes (AVs) or by lysosomes over the total cell area in the image was quantified. Data were expressed as mean ± SEM normalized on WT untreated (dashed line on the graph) (n = 3 independent experiments, with 58 WT and 61 KO rapa-treated neurons analyzed). N nucleus, AV autophagosome, *=enlarged lysosomes. Unpaired T-test, *p < 0.05 (Avs surface fraction: rapa WT vs rapa KO p = 0.0437; Lysosome/ LE surface fraction: WT rapa vs KO rapa p = 0.2410). (B) Representative images of WT and KO primary cortical neurons (14 DIV) loaded with Fluo-4 and exposed to 100 µM NMDA. Scale bar: 40 µm. Data indicate the Fluo-4 intensity (ΔF/F0) of WT and KO treated neurons (violin plots, median ± quartiles; n = 105 cells for WT untreated, n = 32 cells for WT rapamycin, n = 63 cells for KO untreated and n = 20 cells for KO rapamycin). Two-way ANOVA followed by Tukey’s multiple comparisons test *p < 0.05, **p < 0.01, ***p < 0.001, ****p < 0.0001 (ut WT vs ut KO p = 0.0004, ut WT vs rapa WT p < 0.0001, ut WT vs rapa KO p = 0.9243, ut KO vs rapa WT p = 0.0052, ut KO vs rapa KO p = 0.0116, rapa WT vs rapa KO p < 0.0001). (C) The graph reports the average number of intersections measured by Sholl analysis every 15 μm from the soma of WT untreated (N = 30 from 2 embryos) or treated (N = 48 from 2 embryos) and KO untreated (N = 30 from 2 embryos) or treated (N = 48 from 2 embryos) neurons. Error bars indicate ±SEM.
Figure EV5
Figure EV5. Behavioral tests and lifespan analysis in WT and Mecp2 KO mice upon trehalose treatment.
(A) Cumulative score. (B) Speed. (C) Unsupported rearing. (D) Marble burying assay. (E) Kaplan–Mayer survival curve of the four experimental groups: WT untreated (N = 9) or treated (N = 11), and Mecp2-KO untreated (N = 10) or treated (N = 14). For Marble analysis, n = 15 WT vehicle, 12 = KO vehicle, 14 = WT trehalose, 15 = KO trehalose. Bars represent mean values with ± SEM. Behavioral data for BD were analyzed using two-way ANOVA followed by Tukey’s multiple comparisons test *p < 0.05, **p < 0.01, ***p < 0.001, ****p < 0.0001 (Speed: ut WT vs ut KO p = 0.0386, ut WT vs treh WT p = 0.8493, ut WT vs treh KO p = 0.9714, ut KO vs treh WT p = 0.0029, ut KO vs treh KO p = 0.0545, treh WT vs treh KO p = 0.5258; Unsupported rearing: ut WT vs ut KO p = 0.2223, ut WT vs treh WT p = 0.9844, ut WT vs treh KO p = 0.9177, ut KO vs treh WT p = 0.0894, ut KO vs treh KO p = 0.0349, treh WT vs treh KO p = 0.9918; Marble: ut WT vs ut KO p = 0.0032, ut WT vs treh WT p = 0.1181, ut WT vs treh KO p = 0.1366, ut KO vs treh WT p > 0.0001, ut KO vs treh KO p = 0.3951, treh WT vs treh KO p = 0.0003). Statistics for the survival curves were performed by log-rank test.

References

    1. Amir RE, Van den Veyver IB, Wan M, Tran CQ, Francke U, Zoghbi HY (1999) Rett syndrome is caused by mutations in X-linked MECP2, encoding methyl-CpG-binding protein 2. Nat Genet 23:185–188 - PubMed
    1. Barral DC, Staiano L, Guimas Almeida C, Cutler DF, Eden ER, Futter CE, Galione A, Marques ARA, Medina DL, Napolitano G et al (2022) Current methods to analyze lysosome morphology, positioning, motility and function. Traffic 23:238–269 - PMC - PubMed
    1. Bedogni F, Cobolli Gigli C, Pozzi D, Rossi RL, Scaramuzza L, Rossetti G, Pagani M, Kilstrup-Nielsen C, Matteoli M, Landsberger N (2016) Defects during mecp2 null embryonic cortex development precede the onset of overt neurological symptoms. Cereb Cortex 26:2517–2529 - PubMed
    1. Belevich I, Joensuu M, Kumar D, Vihinen H, Jokitalo E (2016) Microscopy image browser: a platform for segmentation and analysis of multidimensional datasets. PLoS Biol 14:e1002340 - PMC - PubMed
    1. Bingol B (2018) Autophagy and lysosomal pathways in nervous system disorders. Mol Cell Neurosci 91:167–208 - PubMed

MeSH terms