. 2025 Mar;32(3):447-465.
doi: 10.1038/s41418-024-01397-0. Epub 2024 Oct 15.

SOX4 facilitates brown fat development and maintenance through EBF2-mediated thermogenic gene program in mice

Affiliations

SOX4 facilitates brown fat development and maintenance through EBF2-mediated thermogenic gene program in mice

Shuai Wang et al. Cell Death Differ. 2025 Mar.

Abstract

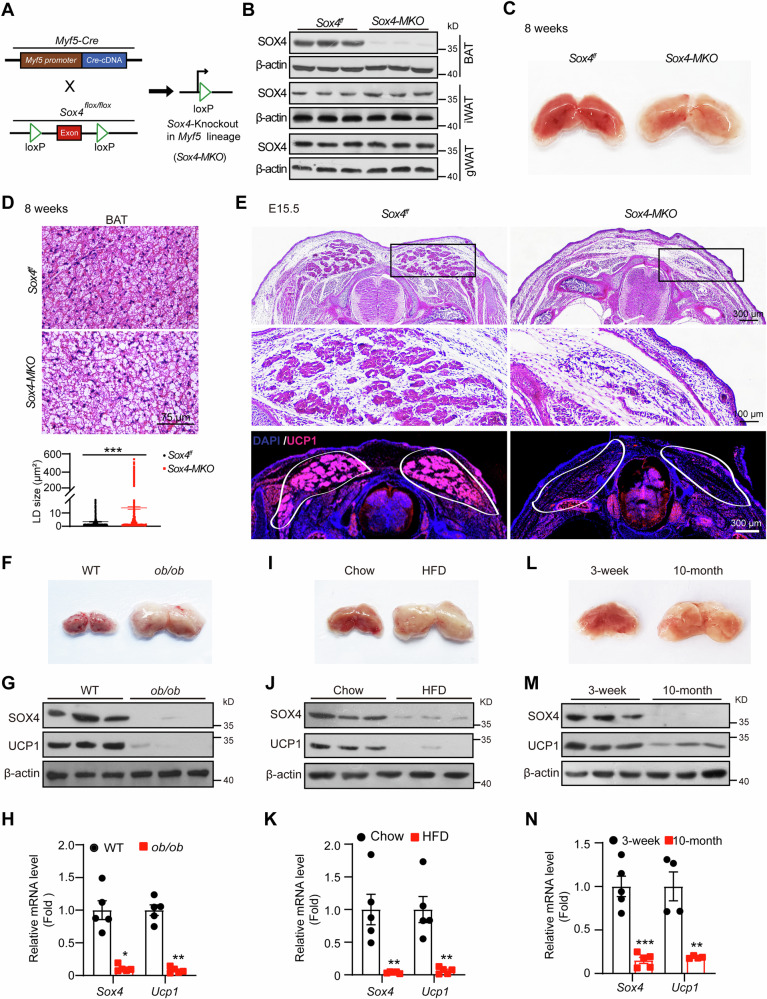
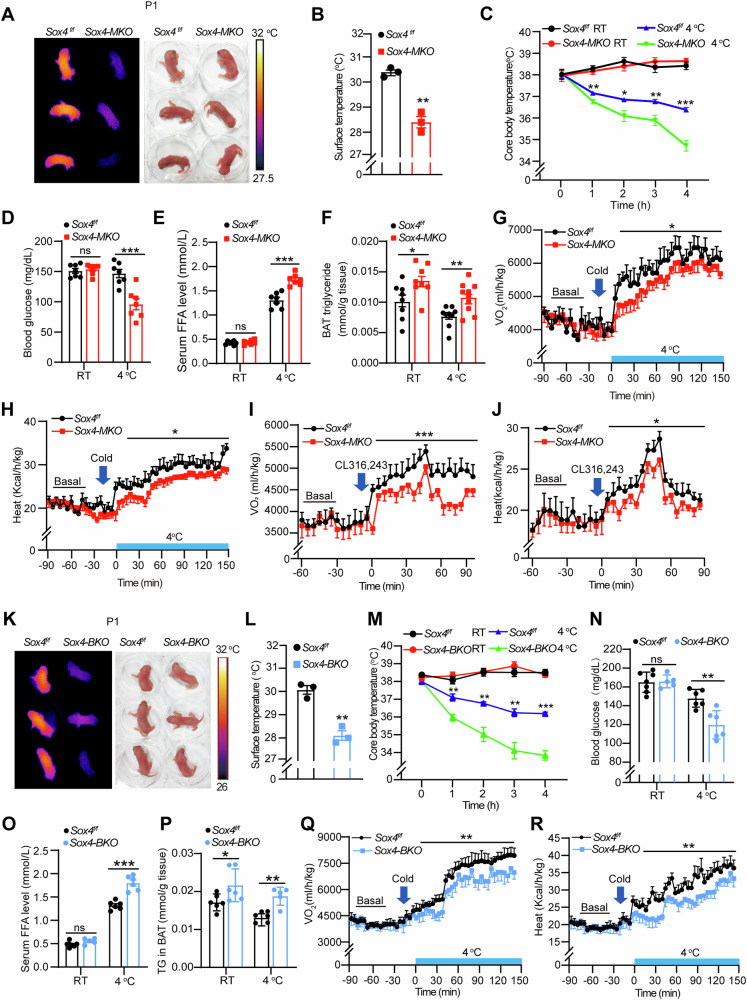
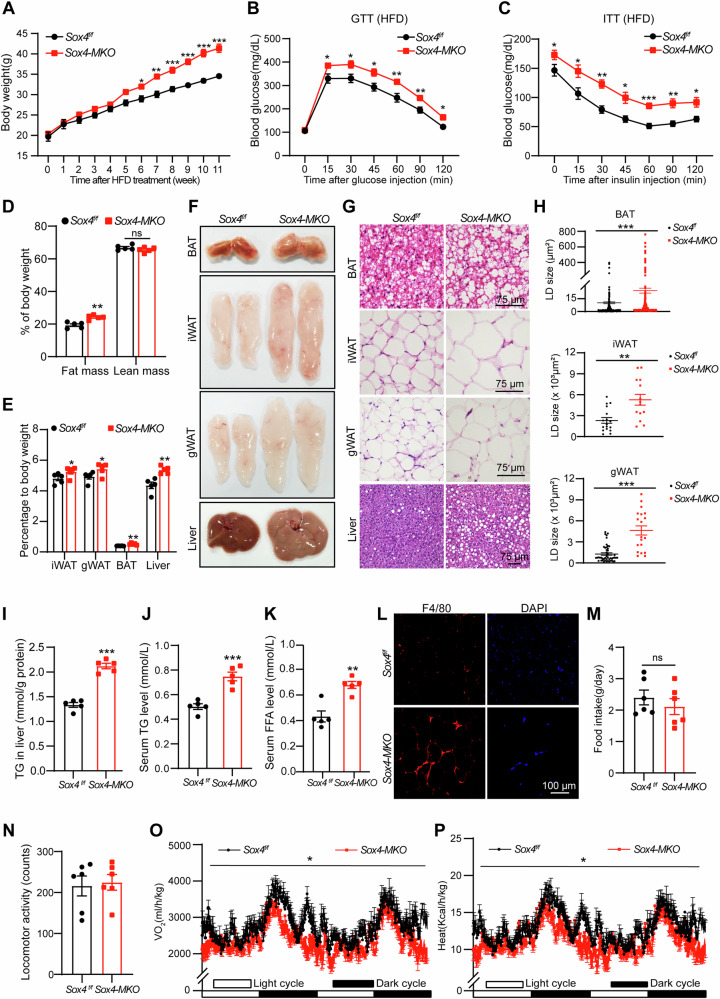
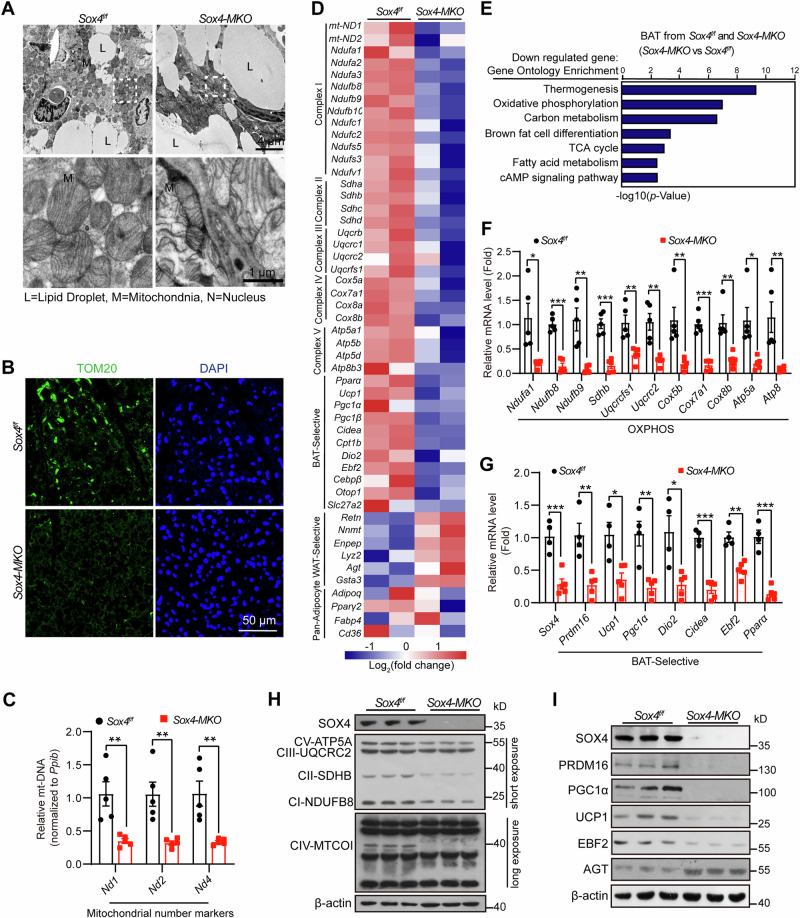
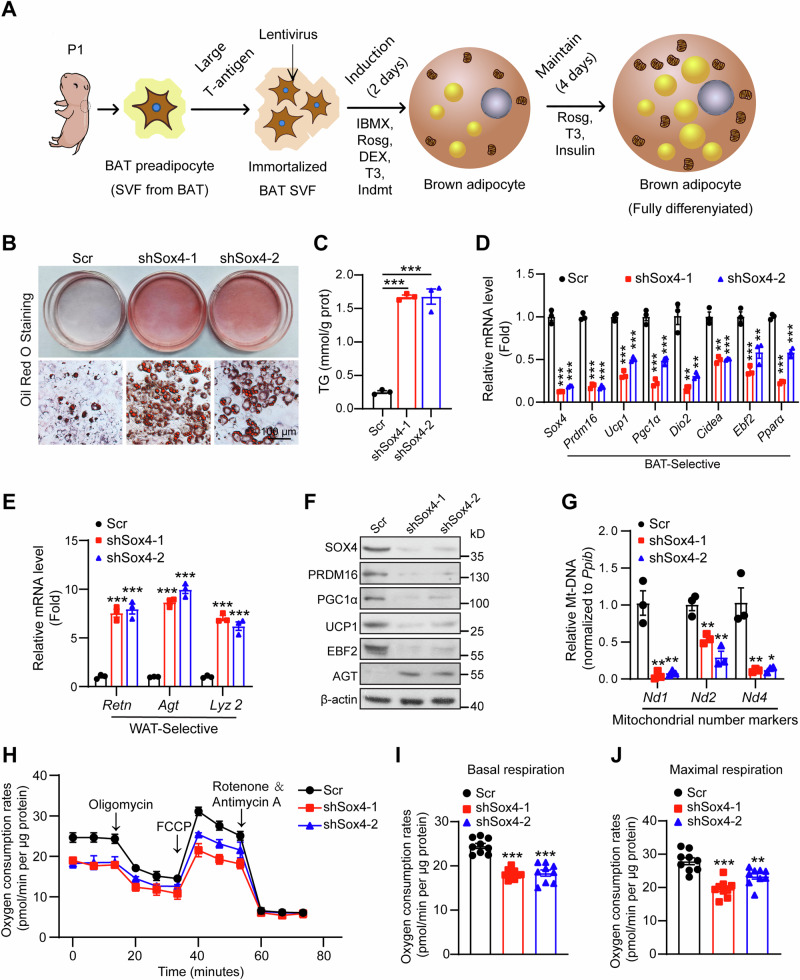
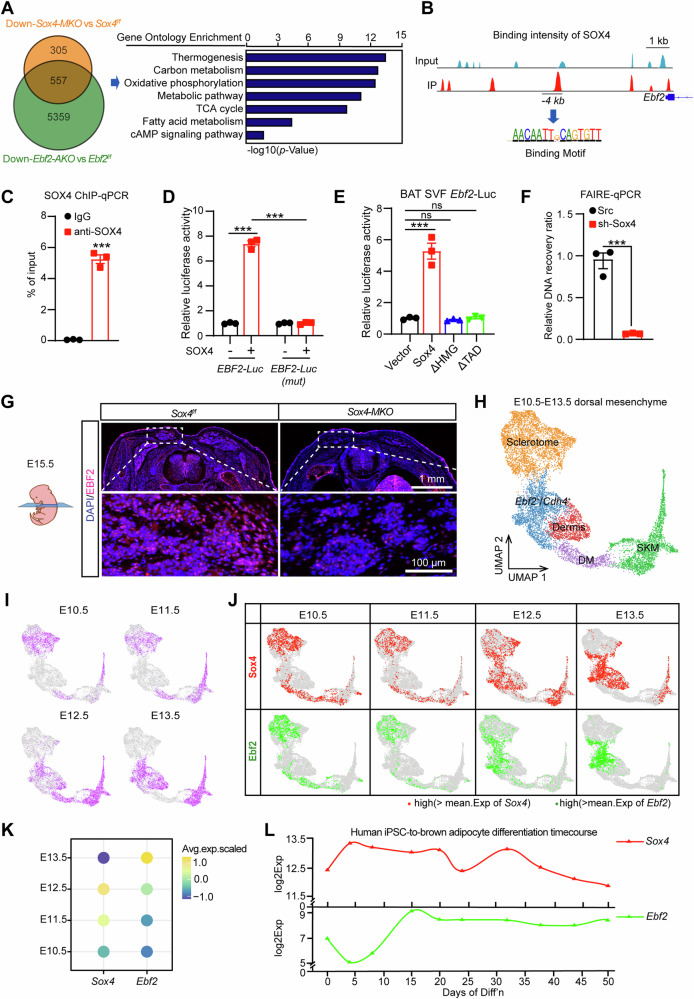
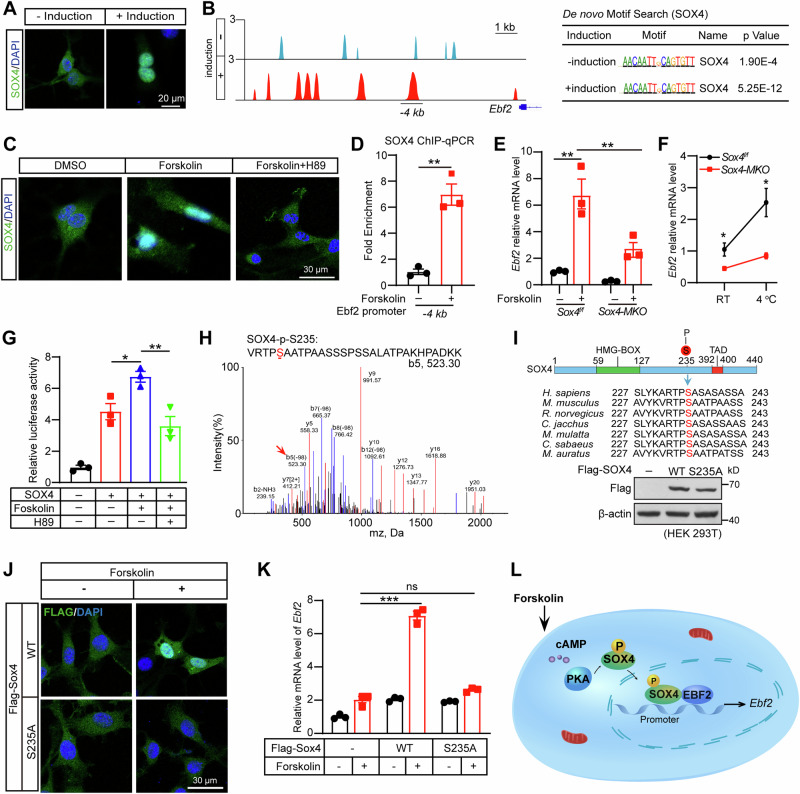
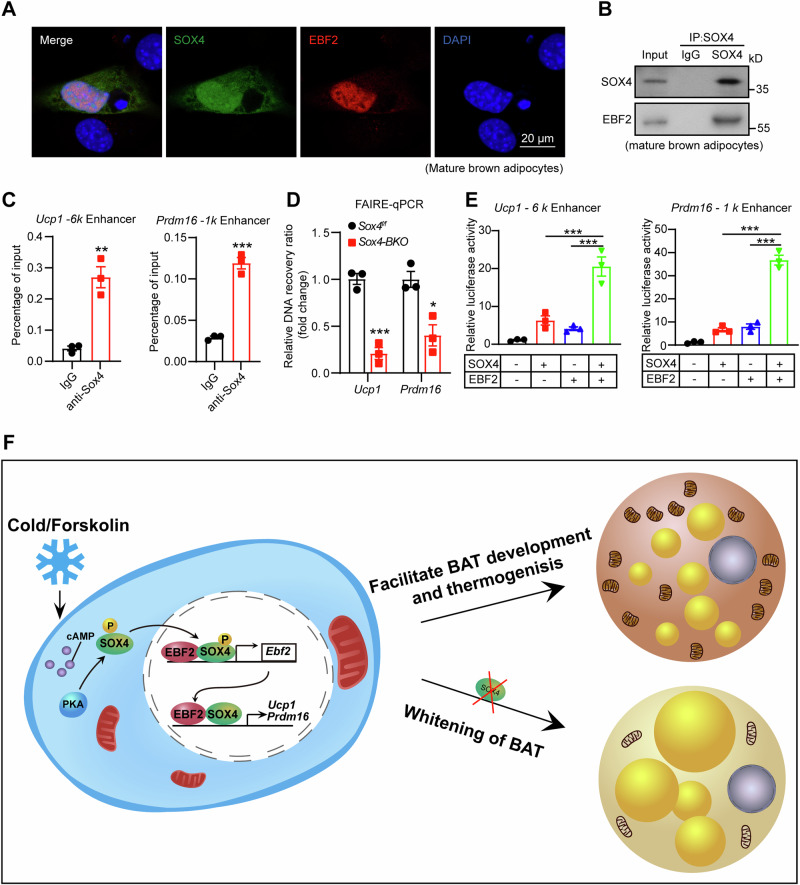
Brown adipose tissue (BAT) is critical for non-shivering thermogenesis making it a promising therapeutic strategy to combat obesity and metabolic disease. However, the regulatory mechanisms underlying brown fat formation remain incompletely understood. Here, we found SOX4 is required for BAT development and thermogenic program. Depletion of SOX4 in BAT progenitors (Sox4-MKO) or brown adipocytes (Sox4-BKO) resulted in whitened BAT and hypothermia upon acute cold exposure. The reduced thermogenic capacity of Sox4-MKO mice increases their susceptibility to diet-induced obesity. Conversely, overexpression of SOX4 in BAT enhances thermogenesis counteracting diet-induced obesity. Mechanistically, SOX4 activates the transcription of EBF2, which determines brown fat fate. Moreover, phosphorylation of SOX4 at S235 by PKA facilitates its nuclear translocation and EBF2 transcription. Further, SOX4 cooperates with EBF2 to activate transcriptional programs governing thermogenic gene expression. These results demonstrate that SOX4 serves as an upstream regulator of EBF2, providing valuable insights into BAT development and thermogenic function maintenance.


Conflict of interest statement

Competing interests: The authors declare no competing interests. Ethics: All mouse experiments were approved and complied with the guidelines of the Institutional Animal Care and Research Advisory Committee at Xiamen University, China (Permit Number: XMULAC20230105).

Figures

Fig. 1
Fig. 1. SOX4 is required for BAT development and maintenance.
A The strategy of generating Sox4-MKO is achieved by intercrossing Myf5-Cre mice with Sox4f/f mice. B The protein levels of SOX4 in BAT, iWAT and gWAT of Sox4-MKO mice and control male mice (8-week-old, n = 3). C Representative images of BAT isolated from 8-week-old Sox4f/f and Sox4-MKO male mice. D Representative images of H&E staining of BAT (top panel, Scale bar, 75 μm) and the quantification of lipid droplets size from BAT (bottom panel) (***p < 0.001, data are presented as mean ± SEM, statistical analysis were determined by unpaired two-tailed Mann-Whitney test). E H&E staining and immunofluorescence (IF) analysis of representative sections from the interscapular regions of E15.5 Sox4f/f and Sox4-MKO embryos. Scale bars are as indicated. FN Analysis of BATs isolated from WT and ob/ob male mice (16-week-old, n = 5) (FH), chow-diet-fed and HFD-fed male mice (16-week-old, n = 5) (IK), 3-week-old and 10-month-old male mice (n = 5) (LN). Representative images of BATs were shown in (F, I, L). Western blot analysis of SOX4 and UCP1 (G, J, M). qRT-PCR analysis of the mRNA levels of Sox4 and Ucp1 (H, K, N). 18S was used as an invariant control. The mRNA levels in control mice were normalized to 1.0. Asterisks (*) denote the level of statistical significance. *p < 0.05, **p < 0.01, ***p < 0.001. Data are presented as mean ± SEM. Statistical analyses were determined by unpaired two-tailed Student’s t-test (K) and unpaired two-tailed Mann-Whitney test (H, N).
Fig. 2
Fig. 2. SOX4 is required for thermogenesis of BAT.
A, B Infrared imaging of newborns (P1, male mice, n = 3) of Sox4-MKO and control littermates (A), and their skin temperatures from the infrared images were quantified and shown in (B). CF Changes in core body temperature of Sox4f/f and Sox4-MKO male mice (8-weeks-old, male) at room temperature (Sox4f/f, n = 7; Sox4-MKO, n = 8) or during acute cold exposure at 4 °C for 4 hours (Sox4f/f, n = 4; Sox4-MKO, n = 6) (C). After cold tolerance test (CTT), blood glucose was collected from tail vein and the levels of blood glucose was measured (n = 7) (D). The serum levels of free fatty acid (FFA) were measured (n = 7) (E). Triglyceride (TG) content in BAT tissue was measured at the end of the experiment ((RT: Sox4f/f, n = 8; Sox4-MKO, n = 8), (4 °C: Sox4f/f, n = 9; Sox4-MKO, n = 10)) (F). G, H Sox4f/f and Sox4-MKO male mice (9-weeks-old, male) were switched from 22 °C to 4 °C, and the oxygen consumption (G) and heat production (H) were monitored by metabolic cage for 150 min (n = 6). I, J Sox4f/f and Sox4-MKO male mice (8-weeks-old, male) were intraperitoneally injected with CL316,243 (1 mg/kg), and the oxygen consumption (I) and heat production (J) were monitored using metabolic cage (n = 6). K, L Infrared imaging of newborns (P1, male mice, n = 3) from Sox4-BKO and respective control mice (K), and their skin temperatures from the infrared images were quantified and shown in (L). MP Changes in core body temperature changes of Sox4-BKO and control male mice (8-weeks old) at room temperature (Sox4f/f, n = 7; Sox4-BKO, n = 8) or 4 °C for 4 h (Sox4f/f, n = 4; Sox4-BKO, n = 6) (M). Blood glucose levels (N) and serum levels of FFA (O) were measured after the cold tolerance test ((RT: Sox4f/f, n = 7; Sox4-BKO, n = 5), (4 °C: Sox4f/f, n = 6; Sox4-BKO, n = 6)). TG content in BAT tissue was measured at the end of the experiment ((RT: Sox4f/f, n = 6; Sox4-BKO, n = 6), (4 °C: Sox4f/f, n = 6; Sox4-BKO, n = 5)) (P). Q, R Sox4f/f and Sox4-BKO male mice (9-weeks-old) were switched from 22 °C to 4 °C, and the oxygen consumption (Q) and heat production (R) were monitored using metabolic cage for 150 min (n = 5). Asterisks (*) denote the level of statistical significance. ns, no significance, *p < 0.05, **p < 0.01, ***p < 0.001. Data are presented as mean ± SEM. Statistical analyses were determined by unpaired two-tailed Student’s t-test (B-J, LR).
Fig. 3
Fig. 3. Loss of SOX4 in BAT promotes HFD-induced obesity.
A The 6-week-old male Sox4f/f and Sox4-MKO mice (Sox4f/f, n = 5; Sox4-MKO, n = 6) were subjected to HFD feeding. Body weight was monitored every week. B On week 9, mice were fasted for 16 h and then received an intraperitoneal injection of D-glucose (1.5 mg/kg) for glucose tolerance test. Blood glucose levels were measured from tail vein at indicated time (n = 5). C On week 11, mice were fasted for 6 h and then received an intraperitoneal injection of insulin at a dose of 1 U/kg for an insulin tolerance test. Blood glucose levels were measured from tail vein at indicated time (n = 5). D On week 9, the average fat and lean mass of Sox4f/f and Sox4-MKO male mice were measured using Echo MRI composition analyzer (n = 5). EH At the end of HFD feeding period, mice were sacrificed. The BAT, iWAT, gWAT, liver and blood were collected. The ratios of tissue weight/body weight were plotted in (E) (n = 5). Representative appearance (F) and H&E staining (G) were shown. Scale bar, 75 μm.The sizes of lipid droplets from the H&E staining images (G) were quantified using ImageJ (H). The TG content of liver was measured (I) (n = 5). J, K Serum levels of TG (J) and FFA (K) were measured (n = 5). L Immunofluorescence (IF) analysis for the F4/80 expression in gWAT from HFD-fed mice, Scale bar, 100 μm. MP On week 11, the HFD-fed mice were subjected to metabolic cage analysis. Food intake (M), locomotor activity (N), oxygen consumption (O) and heat production (P) of mice were measured in 2 consecutive days (n = 6). Asterisks (*) denote the level of statistical significance. ns, no significance, *p < 0.05; **p < 0.01; ***p < 0.001. Data are presented as mean ± SEM. Statistical analyses were determined by unpaired two-tailed Student’s t-test (AE, H, middle panel; IK, MP) and unpaired two-tailed Mann-Whitney test (H, top panel and bottom panel).
Fig. 4
Fig. 4. Deletion of SOX4 impairs expression of BAT-selective genes in vivo.
A Transmission electron micrograph of BAT from 4-week-old male Sox4-MKO and control littermates (LD, lipid droplet; M, mitochondria; N, nucleus). Scale bars are as indicated. B Immunofluorescence (IF) analysis for the TOM20 expression in BAT of 10-week-old male mice. Scale bar, 50 μm. C Mitochondrial-specific transcripts (Nd1, 2 and 4) were measured by qPCR in BAT mitochondrial DNA (mt-DNA) of 9-week-old Sox4-MKO and control male mice (n = 5). Ppib was used as an invariant control. The mRNA levels in control mice were normalized to 1.0. D, E Sox4f/f and Sox4-MKO male mice (15-week-old) were sacrificed and BAT tissue were collected for RNA-seq analysis. Heat map analysis of the representative genes (D). The down-regulated genes were used for clustering analysis and were plotted in (E). F RT-PCR analysis of mitochondrial complex genes in BAT of 9-week-old male Sox4-MKO and control littermates (n = 5). 18S was used as an invariant control. The mRNA levels in control mice were normalized to 1.0. G RT-PCR analysis of the representative BAT-selective gene in BAT of 9-week-old male Sox4-MKO and their respective control mice (Sox4f/f, n = 4; Sox4-MKO, n = 5). 18S was used as an invariant control. The mRNA levels in control mice were normalized to 1.0. H Western blot analysis of SOX4 and mitochondrial respiratory chain components in BAT from 9-week-old male Sox4-MKO and control mice (n = 3). I Western blot analysis of BAT-selective proteins and AGT protein in BAT from 9-week-old male Sox4-MKO and control mice (n = 3). Asterisks (*) denote the level of statistical significance. *p < 0.05, **p < 0.01, ***p < 0.001. Data are presented as mean ± SEM. Statistical analyses were determined by unpaired two-tailed Student’s t-test (C, F, G).
Fig. 5
Fig. 5. SOX4 is required for brown adipocyte differentiation in vitro.
A Schematic drawing showed that the immortalized BAT SVF cells were established and differentiated into mature adipocytes. B, C The immortalized BAT SVF cells infected with scrambled or shSox4 lentivirus were differentiated into mature adipocytes as indicated in Fig. 5A. On day 6 of differentiation, mature brown adipocytes were subjected to Oil Red O staining (B) and triglyceride measurement (C) (n = 3). Scale bar, 100 μm. D, E The mRNA levels of BAT-selective genes (D) and WAT-selective genes (E) in differentiated BAT adipocytes generated as in (A) (n = 3). 18S was used as an invariant control. The mRNA levels in control cells were normalized to 1.0. F The protein levels of BAT enriched proteins and AGT in mature brown adipocytes. G RT-PCR analysis of mitochondrial number markers in mature brown adipocytes (n = 3). Ppib was used as an invariant control. The mRNA levels in control cells were normalized to 1.0. HJ BAT SVF cells were infected with scrambled or shSox4 lentivirus and analyzed for Oxygen consumption rate (OCR) at day 6 of differentiation. Oligomycin, FCCP, and Rotenone / Antimycin were added at the time points indicated by the arrows and OCR was showed in (H). The averaged basal and maximal respiration rates were shown in (I) and (J), respectively (n = 3). Asterisks (*) denote the level of statistical significance. *p < 0.05, **p < 0.01, ***p < 0.001. Data are presented as mean ± SEM. Statistical analyses were determined by unpaired two-tailed Student’s t-test (CE, GJ).
Fig. 6
Fig. 6. SOX4 activates transcription of EBF2 facilitating BAT development.
A RNA-seq data from Sox4-MKO BAT with that from Ebf2-AKO BAT (GSE144188). The overlapping down-regulated genes were subjected to gene ontology analysis (right). B ChIP-seq revealed a significantly enriched binding of SOX4 at -4k upstream of the Ebf2 promoter. C ChIP analysis showing SOX4 protein occupancy at -4k upstream of the Ebf2 promoter in BAT SVF (n = 3). D Luciferase activity of wild-type or SOX4-binding site mutant pGL4.26-EBF2 vectors in NIH3T3 cells transfected with or without SOX4 (n = 3). E Relative transcriptional activity of the Ebf2 promoter in NIH3T3 cells with expression of vector, SOX4, ΔHMG and ΔTAD (n = 3). F BAT SVF cells were infected with scrambled or shSOX4 lentiviruses for 2 days and then subjected to FAIRE assay. The enriched DNAs were examined by qPCR for the Ebf2 promoter (n = 3). G Immunofluorescence (IF) analysis for the EBF2 expression in E15.5 Sox4f/f and Sox4-MKO embryos. Scale bars are as indicated. H UMAP of 10,163 mesenchymal and skeletal muscle cells from E10.5 to E13.5 mouse embryos, indicating clusters expected to be found in the dorsal region of the mouse embryo, where BAT develops. I Cells in (H) highlighted by developmental stage of origin. J Sox4 and Ebf2 expressions in different cell clusters from E10.5 to E13.5. K Dot plot shows the average expression level of Ebf2 and Sox4 from E10.5 to E13.5 mouse embryos. L The mRNA expression levels of Sox4 and Ebf2 during the differentiation of human iPSCs into brown adipocytes. Asterisks (*) denote the level of statistical significance. ns, no significance, ***p < 0.001. Data are presented as mean ± SEM. Statistical analyses were determined by unpaired two-tailed Student’s t-test (C, F), one-way ANOVA followed by Tukey’s test (E) and two-way ANOVA followed by Tukey’s test (D).
Fig. 7
Fig. 7. Phosphorylation of SOX4 by PKA facilitates its nuclear translocation and enhances the transcription of EBF2.
A BAT SVF cells were treated with or without induction medium for 1 h. Then cells were fixed and subjected into immunostaining by using anti-SOX4 antibody. Scale bar, 20 μm. B Control and 3X HA-SOX4 expressing BAT SVF cells were treated with or without induction medium for 1 h. Cells were harvested and subjected into chromatin immunoprecipitation by using anti-HA antibody. ChIP-Seq analysis showed binding profiles of SOX4 on the promoter of Ebf2 and de novo motif analysis of SOX4 binding sites. C BAT SVF cells were treated with DMSO, forskolin (20 μM) or H89 (30 μM) prior to stimulation with forskolin (20 μM) for 60 min. After 1 hour of stimulation, we performed immunofluorescence assay to detect the cytoplasmic-nuclear distribution of SOX4 protein. Scale bar, 30 μm. D ChIP-qPCR showing Sox4 occupancy at the promoter of Ebf2 in BAT SVF treated without or with forskolin (20 μM) for 1 h (n = 3). E BAT SVF cells isolated from 3-week-old Sox4-MKO and control littermates were cultured to confluence. Cells were treated with or without forskolin (20 μM) for 1 h and then harvested for RT-qPCR analysis (n = 3). 18S was used as an invariant control. The mRNA levels in control cells were normalized to 1.0. F Sox4f/f and Sox4-MKO mice (8-week-old male, n = 4) were housed at RT or 4 °C for 4 h. Subsequently, mice were dissected, and BAT was collected. BAT SVFs were isolated from BAT for qPCR analysis of Ebf2. G BAT SVF reaching indicated confluence were subjected to different supplement (PBS, forskolin or H89) as described in (C). Transcriptional activity of the Ebf2 enhancer in NIH3T3 were analyzed by luciferase reporter assay (n = 3). H Mass spectrometry analysis of phosphorylation sites on SOX4. HEK293T cells were transfected with WT-PRKACA (catalytic subunit of PKA) or a kinase-dead mutant of PKA (KD-PRKACA) together with HA-SOX4 for 48 h. The cells were lysed and subjected to immunoprecipitation (IP) against HA, then the pellet was separated on SDS-PAGE and subjected to mass spectrometry analysis. I Alignment of SOX4 residues S325, along with the flanking amino acid residues from different species. HEK293T cells were transfected with WT or S235A mutant of SOX4. After 48 hours, cells were harvested and analyzed by western blot (n = 3). J, K NIH3T3 were transfected with Flag-SOX4 (WT) or S235A mutant. 36 h later, cells were treated with DMSO or forskolin (20 μM) for 1 h. And then cells were fixed for immunofluorescence assay (J) (Scale bar, 30 μm) or collected for qPCR analysis (K) (n = 3). L The illustration showed that forskolin induces PKA activation, leading to the phosphorylation of SOX4 at S235 and its subsequent translocation into the nucleus. Once in the nucleus, SOX4 cooperates with EBF2 to activate transcription of EBF2. Asterisks (*) denote the level of statistical significance. *p < 0.05, **p < 0.01, ***p < 0.001. Data are presented as mean ± SEM. Statistical analyses were determined by unpaired two-tailed Student’s t-test (D, F), one-way ANOVA followed by Tukey’s test (G) and two-way ANOVA followed by Tukey’s test (E, K).
Fig. 8
Fig. 8. SOX4 cooperates with EBF2 to enhance expression of thermogenic genes.
A Primary BAT SVFs were isolated from BAT of 8-week-old male WT mouse and then subjected to differentiation. On day 6 of differentiation, cells were harvested and subjected to immunofluorescence analysis. Immunofluorescence analysis showed the co-localization of SOX4 and EBF2 in the nucleus of mature BAT adipocyte. Scale bar, 20 μm. B BAT SVF cells were differentiated for 6 days, followed by lysis and immunoprecipitation using anti-SOX4 antibody or IgG. Input and pellet fractions were subsequently analyzed by western blot using the indicated antibodies. C BAT SVF cells expressing Flag-SOX4 were subjected to differentiation for 6 days. Following this, cells were harvested, and ChIP assay was performed with the FLAG antibody. The occupancy of SOX4 at -6k region of Ucp1 reporter and-1k region of Prdm16 reporter were analyzed by qPCR (n = 3). D The BAT SVFs isolated from 3-week-old Sox4-BKO and control mice were differentiated into mature adipocytes. On day 6 of differentiation, cells were subjected to the FAIRE assay, and the enriched DNAs were examined by qPCR for the site -5851 upstream of the Ucp1 promoter or the site -885 upstream of the Prdm16 promoter (n = 3). E Transcriptional activity of the - 6 kb upstream of Ucp1 promoter and - 1 kb upstream of Prdm16 promoter was assessed in NIH3T3 cells upon overexpression of SOX4, EBF2, or both (n = 3). F A schematic model showing that cold stimuli or forskolin treatment induces the activation of PKA, which subsequently phosphorylates SOX4 to facilitate its translocation into the nucleus. Within the nucleus, SOX4 collaborates with EBF2 to enhance transcription of both EBF2 and downstream thermogenic genes. Asterisks (*) denote the level of statistical significance. *p < 0.05, **p < 0.01, ***p < 0.001. Data are presented as mean ± SEM. Statistical analyses were determined by unpaired two-tailed Student’s t-test (C, D), and one-way ANOVA followed by Tukey’s test (E).

Similar articles

References

    1. Chen J, Xu X, Li Y, Li F, Zhang J, Xu Q, et al. Kdm6a suppresses the alternative activation of macrophages and impairs energy expenditure in obesity. Cell Death Differ. 2021;28:1688–704. - PMC - PubMed
    1. Cannon B, Nedergaard J. Brown adipose tissue: function and physiological significance. Physiol Rev. 2004;84:277–359. - PubMed
    1. Cypess AM, Lehman S, Williams G, Tal I, Rodman D, Goldfine AB, et al. Identification and importance of brown adipose tissue in adult humans. N Engl J Med. 2009;360:1509–17. - PMC - PubMed
    1. Kajimura S, Saito M. A new era in brown adipose tissue biology: molecular control of brown fat development and energy homeostasis. Annu Rev Physiol. 2014;76:225–49. - PMC - PubMed
    1. Kajimura S, Spiegelman BM, Seale P. Brown and beige fat: physiological roles beyond heat generation. Cell Metab. 2015;22:546–59. - PMC - PubMed

MeSH terms

Substances

LinkOut - more resources