. 2024 Oct 14;14(1):23989.
doi: 10.1038/s41598-024-75202-w.

Low to moderate ethanol exposure reduces astrocyte-induced neuroinflammatory signaling and cognitive decline in presymptomatic APP/PS1 mice

Affiliations

Low to moderate ethanol exposure reduces astrocyte-induced neuroinflammatory signaling and cognitive decline in presymptomatic APP/PS1 mice

Shinwoo Kang et al. Sci Rep. .

Abstract

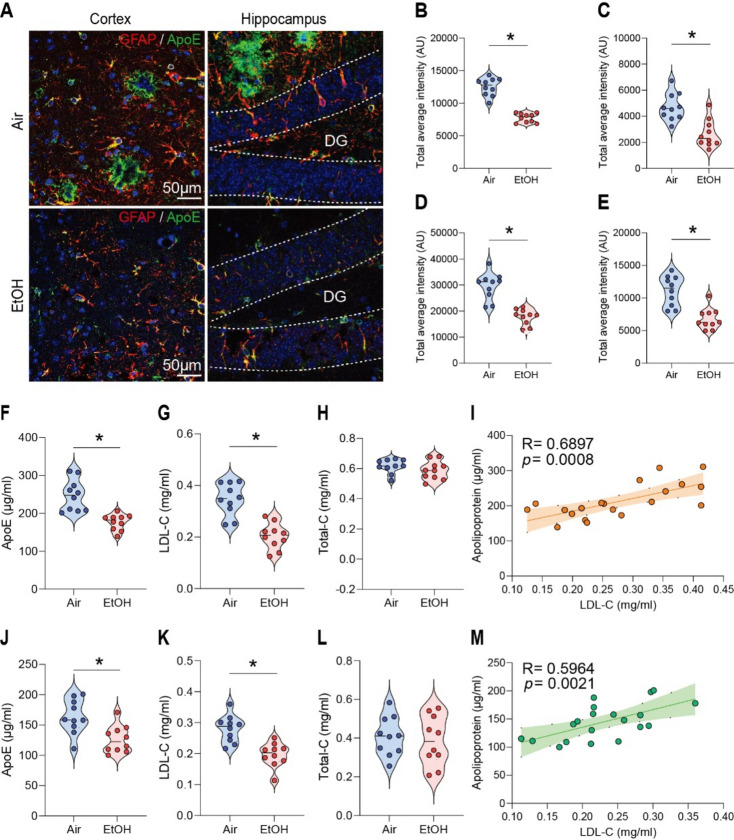
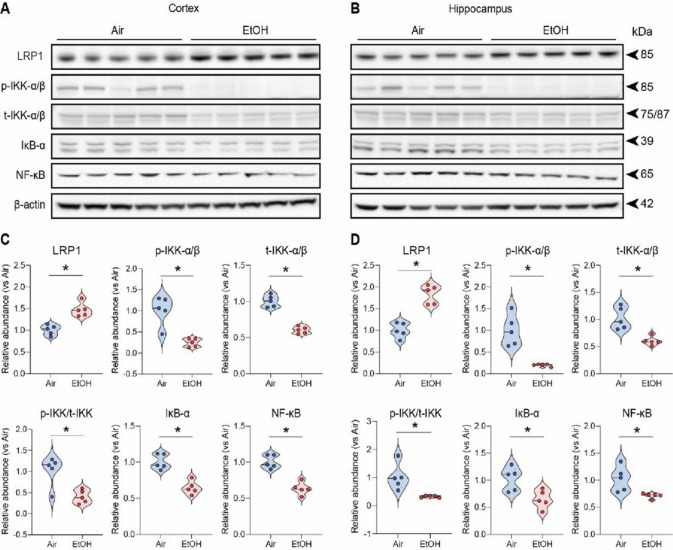
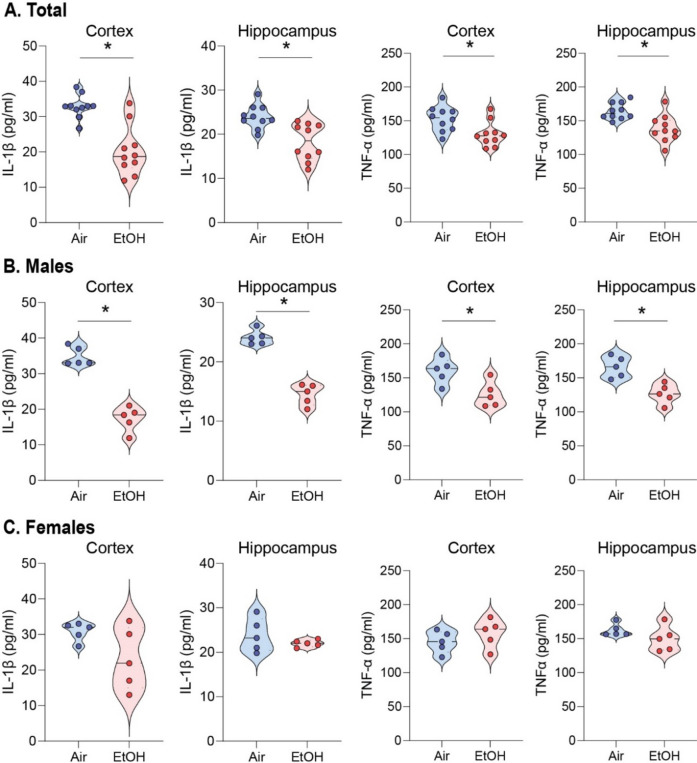
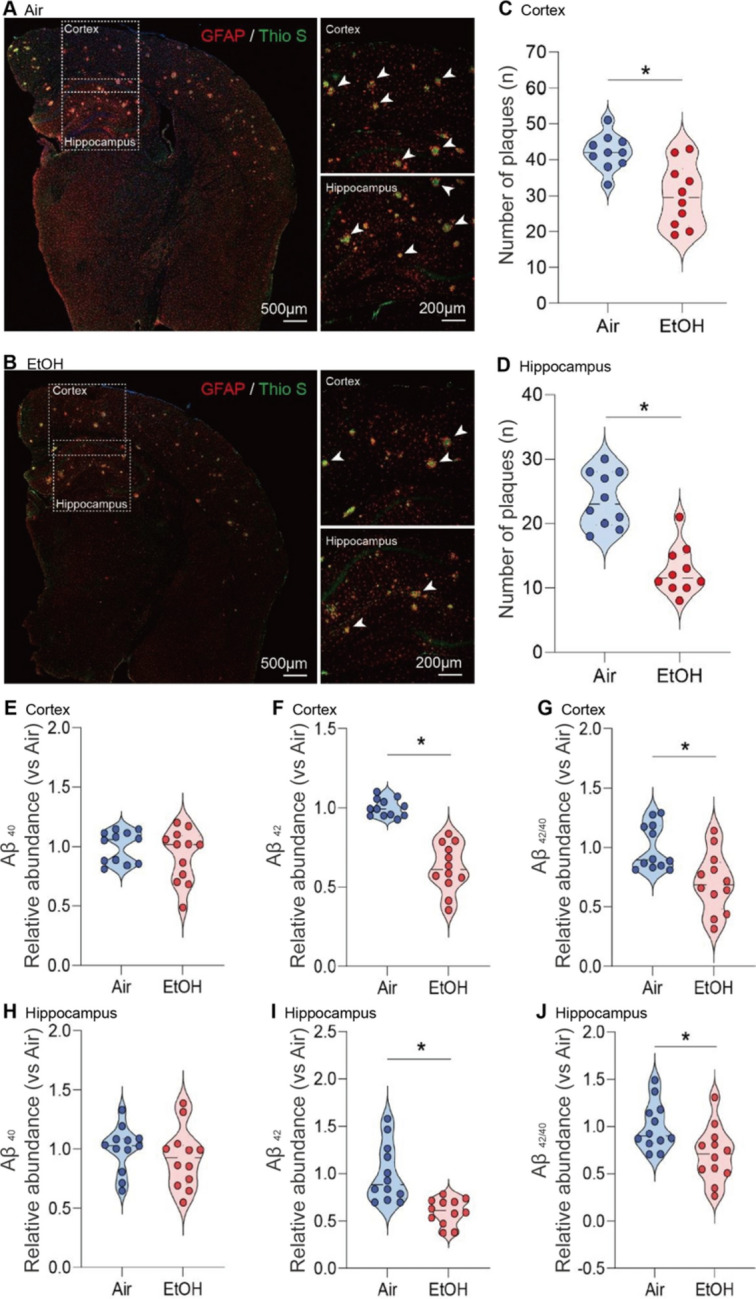
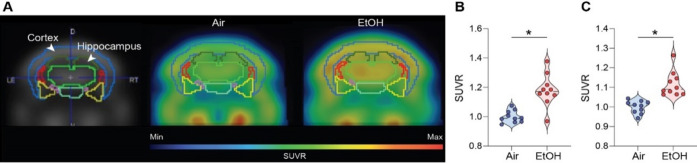
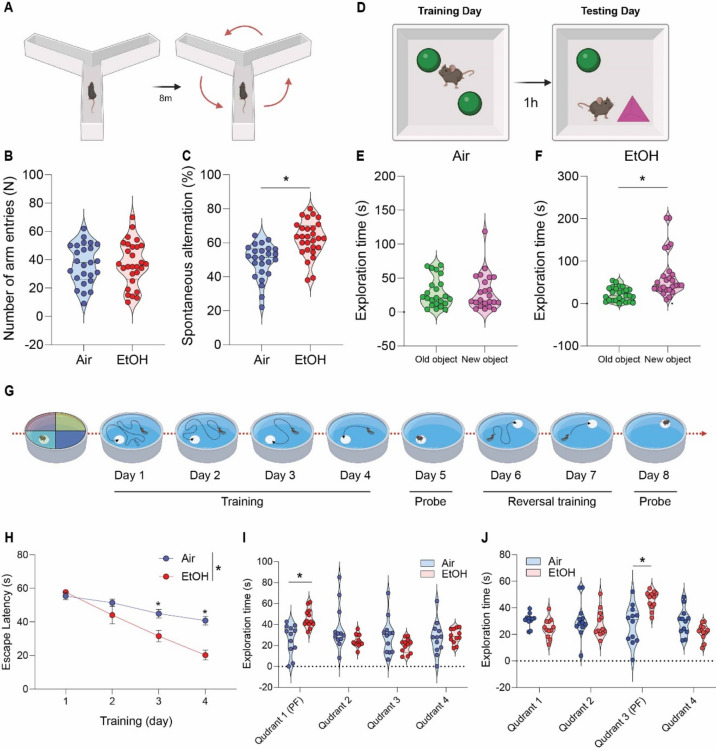
Alcohol use disorder has been associated with the development of neurodegenerative diseases, including Alzheimer's disease (AD). However, recent studies demonstrate that moderate alcohol consumption may be protective against dementia and cognitive decline. We examined astrocyte function, low-density lipoprotein (LDL) receptor-related protein 1 (LRP1), and the NF-κB p65 and IKK-α/β signaling pathways in modulating neuroinflammation and amyloid beta (Aβ) deposition. We assessed apolipoprotein E (ApoE) in the brain of APP/PS1 mice using IHC and ELISA in response to low to moderate ethanol exposure (MEE). First, to confirm the intracerebral distribution of ApoE, we co-stained with GFAP, a marker for astrocytes that biosynthesize ApoE. We sought to investigate whether the ethanol-induced upregulation of LRP1 could potentially inhibit the activity of IL-1β and TNF-α induced IKK-α/β towards NF-κB p65, resulting in a reduction of pro-inflammatory cytokines. To evaluate the actual Aβ load in the brains of APP/PS1 mice, we performed with a specific antibody Aβ (Thioflavin S) on both air- and ethanol-exposed groups, subsequently analyzing Aβ levels. We also measured glucose uptake using 18F- fluorodeoxyglucose (FDG)-positron emission tomography (PET). Finally, we investigated whether MEE induced cognitive and memory changes using the Y maze, noble object recognition test, and Morris water maze. Our findings demonstrate that MEE reduced astrocytic glial fibrillary acidic protein (GFAP) and ApoE levels in the cortex and hippocampus in presymptomatic APP/PS1 mice. Interestingly, increased LRP1 protein expression was accompanied by dampening the IKK-α/β-NF-κB p65 pathway, resulting in decreased IL-1β and TNF-α levels in male mice. Notably, female mice show reduced levels of anti-inflammatory cytokines IL-4, and IL-10 without altering IL-1β and TNF-α concentrations. In both males and females, Aβ plaques, a hallmark of AD, were reduced in the cortex and hippocampus of APP/PS1 mice exposed to ethanol starting at pre-symptomatic stage. Consistently, MEE increased FDG-PET-based brain activities and normalized cognitive and memory deficits in the APP/PS1 mice. Our findings suggest that MEE may benefit AD pathology via modulating LRP1 expression, potentially reducing neuroinflammation and attenuating Aβ deposition. Our study implies that reduced astrocyte-derived ApoE and LDL cholesterol levels are critical for attenuating AD pathology.


Conflict of interest statement

The authors declare no competing interests.

Figures

Fig. 1
Fig. 1
Impact of low to moderate ethanol exposure on ApoE and LDL cholesterol levels in the brains of presymptomatic APP/PS1 mice. (A) Representative immunohistochemistry images of ApoE (green) and GFAP (red) co-staining in the brains of air-exposed and ethanol-exposed APP/PS1 mice. (B and C) ApoE IHC evaluation revealed reduced ApoE levels in the cortex (B) and hippocampus (C) compared to the air exposure group. (D and E) GFAP IHC evaluation showed decreased astrocyte activation in the cortex (D) and hippocampus (E) in the ethanol exposure compared to the air group. (FH) and (JL) Analysis of ApoE, LDL-cholesterol, and Total-cholesterol levels in the cortex and hippocampus by ELISA after low to moderate ethanol exposure. (F) ApoE level in the cortex, G) LDL-cholesterol level in the cortex, (H) Total cholesterol level in the cortex, (I) Correlation in the cortex, (J) ApoE level in the hippocampus, (K) LDL cholesterol level in the hippocampus, (L) Total cholesterol level in the hippocampus. (M) Correlation in the hippocampus. Data represent mean ± SEM; n = 10 per group. *P < 0.05 comparing each group. (B-I and K-N) Two-tailed Mann–Whitney test. (I and M) Spearman correlation analysis. Linear regression (solid line) and 95% confidence bands (shaded are) are shown. See Table S1 for full statistical information.
Fig. 2
Fig. 2
Effects of low to moderate ethanol exposure from IKK-α/β to IκB-α on LRP1 expression and NF-κB signaling in presymptomatic APP/PS1 mice. (A and B) Western blot quantification of LRP1/IKK-α/β/IκB α/NF-κB signaling. (C and D) Western blot results of LRP1/IKK-α/β/IκB-α/NF-κB in the cortex and hippocampus of the presymptomatic APP/PS1 mice brains. β-Actin was used as a loading control. (A and C) Cortex, (B and D) Hippocampus. Data represent mean ± SEM; n = 5 per group. *P < 0.05 comparing each group. Two-tailed Mann–Whitney test. See Fig. S17 for a full Western blot and see Table S1 for full statistical information.
Fig. 3
Fig. 3
Low to moderate ethanol exposure significantly reduces IL-1β and TNF-α levels in both brain regions compared to air-exposed presymptomatic APP/PS1 mice. (A-C) ELISA assay to detect IL-1β and TNF-α levels in the cortex and hippocampus of presymptomatic APP/PS1 mice. (A) Comparison of air and ethanol groups including male and female (B) Comparison of only male mice air and ethanol groups (C) Comparison of only female mice air and ethanol groups. Data represent mean ± SEM; n = 5 per group. *P < 0.05 comparing each group. Two-tailed Mann–Whitney test. See Table S1 for full statistical information.
Fig. 4
Fig. 4
Reduction of Aβ plaque formation in the cortex and hippocampus of ethanol-exposed presymptomatic APP/PS1 mice. (A-D) Immunohistochemistry analysis shows the effects of MEE on Aβ plaque formation in the cortex and hippocampus of presymptomatic APP/PS1 mice. (A and B) Aβ plaques were visualized using Thioflavin S staining. (C and D) the number of plaques was significantly decreased in both cortex and hippocampus of ethanol-exposed presymptomatic APP/PS1 mice compared to air-exposed controls. (E-J) ELISA analysis shows the effects of chronic ethanol exposure on Aβ levels in the cortex and hippocampus of presymptomatic APP/PS1 mice. Quantification of amyloid Aβ1-40,42 levels using ELISA revealed a significant reduction in the cortex (EG) and hippocampus (H-J) of ethanol-exposed presymptomatic APP/PS1 mice after 12 weeks of ethanol exposure compared to age-matched air-exposed presymptomatic APP/PS1 mice. Data represent mean ± SEM; n = 10 per group. *P < 0.05 comparing each group. Two-tailed Mann–Whitney test. See Table S1 for full statistical information.
Fig. 5
Fig. 5
[18F] Fluorodeoxyglucose uptake measured by in vivo microPET. (A) Representative FDG-PET images from air-exposed and ethanol-exposed presymptomatic APP/PS1 mice. The boundaries of ROIs were drawn on the coronal section. Glucose uptake increased in the cortex and hippocampus of ethanol exposed presymptomatic APP/PS1 mice. Quantification of glucose uptake by FDG-PET imaging in the cortex (B) and hippocampus (C). Data represent mean ± SEM; n = 10 per group. *P < 0.05 comparing each group. Two-tailed Mann–Whitney test. See Table S1 for full statistical information.
Fig. 6
Fig. 6
Effect of low to moderate ethanol exposure on cognitive performance in presymptomatic APP/PS1 mice. (A) Y-maze schematic diagram, (B) total arm entries and (C) Y-maze test showing spontaneous alteration for air-exposed and ethanol-exposed presymptomatic APP/PS1 mice. (D) Novel Object Recognition (NOR) task schematic diagram, (E and F) NOR task demonstrating time spent exploring familiar and unfamiliar objects for both groups. (G) Morris water maze (MWM) schematic diagram, (H and I) MWM acquisition training and probe test (J) reversal probe test. Data represent mean ± SEM; n = 12 ~ 28 per group. *P < 0.05 comparing each group. (B-C and EF) Two-tailed Mann–Whitney test (H and J) Two-way ANOVA followed by Tukey’s multiple comparisons tests. See Table S1 for full statistical information.

Update of

References

    1. Kamal, H. et al. Alcohol use disorder, neurodegeneration, Alzheimer’s and Parkinson’s disease: interplay between oxidative stress, neuroimmune response and excitotoxicity. Front. Cell Neurosci.14, 282. 10.3389/fncel.2020.00282 (2020). - PMC - PubMed
    1. Ridley, N. J., Draper, B. & Withall, A. Alcohol-related dementia: an update of the evidence. Alzheimers Res. Ther.5, 3. 10.1186/alzrt157 (2013). - PMC - PubMed
    1. Tyas, S. L. Alcohol use and the risk of developing Alzheimer’s disease. Alcohol Res. Health25, 299–306 (2001). - PMC - PubMed
    1. Barnett, A. et al. Adolescent binge alcohol enhances early Alzheimer’s disease pathology in adulthood through proinflammatory neuroimmune activation. Front. Pharmacol.13, 884170. 10.3389/fphar.2022.884170 (2022). - PMC - PubMed
    1. Tucker, A. E., Alicea Pauneto, C. D. M., Barnett, A. M. & Coleman, L. G. Jr. Chronic ethanol causes persistent increases in Alzheimer’s tau pathology in female 3xTg-AD mice: a potential role for lysosomal impairment. Front. Behav. Neurosci.16, 886634. 10.3389/fnbeh.2022.886634 (2022). - PMC - PubMed

MeSH terms

LinkOut - more resources