. 2024 Nov;6(11):2187-2202.
doi: 10.1038/s42255-024-01143-3. Epub 2024 Oct 14.

Brown fat ATP-citrate lyase links carbohydrate availability to thermogenesis and guards against metabolic stress

Affiliations

Brown fat ATP-citrate lyase links carbohydrate availability to thermogenesis and guards against metabolic stress

Ekaterina D Korobkina et al. Nat Metab. 2024 Nov.

Abstract

Brown adipose tissue (BAT) engages futile fatty acid synthesis-oxidation cycling, the purpose of which has remained elusive. Here, we show that ATP-citrate lyase (ACLY), which generates acetyl-CoA for fatty acid synthesis, promotes thermogenesis by mitigating metabolic stress. Without ACLY, BAT overloads the tricarboxylic acid cycle, activates the integrated stress response (ISR) and suppresses thermogenesis. ACLY's role in preventing BAT stress becomes critical when mice are weaned onto a carbohydrate-plentiful diet, while removing dietary carbohydrates prevents stress induction in ACLY-deficient BAT. ACLY loss also upregulates fatty acid synthase (Fasn); yet while ISR activation is not caused by impaired fatty acid synthesis per se, deleting Fasn and Acly unlocks an alternative metabolic programme that overcomes tricarboxylic acid cycle overload, prevents ISR activation and rescues thermogenesis. Overall, we uncover a previously unappreciated role for ACLY in mitigating mitochondrial stress that links dietary carbohydrates to uncoupling protein 1-dependent thermogenesis and provides fundamental insight into the fatty acid synthesis-oxidation paradox in BAT.


Conflict of interest statement

Competing interests: The authors declare no competing interests.

Figures
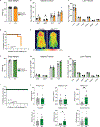
Ext.Data Fig. 1.
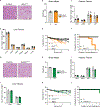
Ext.Data Fig. 1.. ACLY loss in Brown Fat Causes Tissue Whitening and Cold Intolerance in Male Mice.
A. Body weight of the AclyBATKO male mice. n=21 C, 16 KO. B. Adipose tissue weights of the AclyBATKO male mice. *p= 0.0246, *p= 0.0234. n=11 C, 8 KO. C. Lean tissue weights of the AclyBATKO male mice. n=11 C, 8 KO. D. “Survival curve” for cold exposure experiment, where mice maintain body temperature above 30°C, remain in the cold over the time course of experiment. n=C, 6 KO. E. Dorsal view representative infrared thermography image of heat signature of the iBAT from AclyBATKO mouse and littermate control. F. Body weights of the Acss2BATKO male mice. n=6 C, 6 KO. G. Adipose tissue weights of the Acss2BATKO male mice. n=6 C, 6 KO. H. Lean tissue weights of the Acss2BATKO male mice. n=6 C, 6 KO. I. “Survival curve”, how many mice remain in the cold over the time course of experiment. n=6 C, 6 KO. J. Acyl CoA levels measurements in the Acss2BATKO male mice BAT. **p= 0.0052, *p= 0.0170. n=9 C, 10 KO. Data are mean ± s.e.m. Statistical analysis unpaired two-tailed Student’s t-test.
Extended Fig. 2.
Extended Fig. 2.. ACLY loss in Brown Fat Causes Tissue Whitening and Cold Intolerance in Female Mice.
A. Representative H&E of the iBAT from AclyBATKO female mouse and littermate control. Scale bar 50um. Clear consistent phenotype across n=3 mice. B. Body weight of the AclyBATKO female mice. n=7 C, 11 KO. C. Adipose tissue weights of the AclyBATKO female mice. *p= 0.0232. n=7 C, 11 KO. D. Lean tissue weights of the AclyBATKO female mice. n=7 C, 11 KO. E. Rectal temperatures of the AclyBATKO female mice and littermate controls during cold exposure (4°C). n=8 C, 8 KO. F. “Survival curve”, how many mice maintain body temperature above 30°C, remain in the cold over the time course of experiment. n=8 C, 8 KO. G. Representative H&E of the iBAT from Acss2BATKO female mouse and littermate control. Scale bar 50um. Consistent across n=6 mice. H. Body weight of the Acss2BATKO female mice. n=5 C, 6 KO. I. Adipose tissue weights of the Acss2BATKO female mice. n=5 C, 6 KO. J. Lean tissue weights of the Acss2BATKO female mice. n=5 C, 6 KO. K. Rectal temperatures of the Acss2BATKO female mice and littermate controls during cold exposure (4°C). n=4 C, 5 KO. L. “Survival curve”, how many mice maintain body temperature above 30°C, remain in the cold over the time course of experiment. n=4 C, 5 KO. Data are mean ± s.e.m. Statistical analysis unpaired two-tailed Student’s t-test.
Extended Fig. 3.
Extended Fig. 3.. BAT ACLY Loss Broadly Impairs Metabolism.
A. Lipidomics analysis of DAG in the AclyBATKO mice BAT. ***p= 0.0007. n=9 C, 14 KO. B. Lipidomics analysis of TAG in the AclyBATKO mice BAT. n=9 C, 14 KO. C. Lipidomics analysis of CE in the AclyBATKO mice BAT. **p= 0.0035. n=9 C, 14 KO. D. Lipidomics analysis of DAG degree of saturation in the AclyBATKO mice BAT. ***p= 0.0001, **p= 0.0002. n=9 C, 14 KO. E. Lipidomics analysis of TAG degree of saturation in the AclyBATKO mice BAT. **** <0.0001, ***p= 0.0001, ***p= 0.0002. n=9 C, 14 KO. F. D2O labeling of newly synthesized palmitate in the AclyBATKO mice BAT and their littermates. *p= 0.0163. n=8 C, 8 KO. G. Palmitate abundance in BAT of AclyBATKO mice and littermate controls. **p= 0.0087. n=8 C, 8 KO. H. D2O enrichment in plasma of AclyBATKO mice and littermate controls. n=8 C, 8 KO. I. 3H-2-deoxy-glucose uptake assay into interscapular BAT, subscapular BAT, SAT, Quad and Liver of the AclyBATKO mice after 30 min at 4°C. ***p= 0.0003, ***p= 0.0004. n=4 C, 5 KO. J. RT-PCR analysis of Glut1 and Glut4 in the AclyBATKO mice BAT. **p= 0.0015. n=6 C, 6 KO. K. RT-PCR analysis of cd36 and lpl in the AclyBATKO mice BAT. ***p= 0.0001, **p= 0.0072. n=6 C, 6 KO. Panels A-K: grey bar (C), orange bar (AclyBATKO). Data are mean ± s.e.m. Statistical analysis unpaired two-tailed Student’s t-test.
Extended Fig. 4.
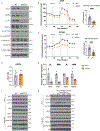
Extended Fig. 4.. The Thermogenic Gene Program Requires ACLY.
A. Western blot of siACLY treated brown mature adipocytes. n=2 samples, result has been replicated. B. Seahorse Mito Stress Test OCR measurements of siACLY treated brown mature adipocytes. ****p <0.0001. n=30NT, n=30 siACLY wells, result has been replicated. C. Seahorse Mito Stress Test ECAR measurements of siACLY treated brown mature adipocytes. ****p <0.0001. n=30NT, n=30 siACLY wells, result has been replicated. D. Mitochondria/Nuclear DNA ratio in the siACLY treated brown mature adipocytes. n=6 C, 6 KO. E. RT-PCR analysis of Acly, Ucp1, Cycs and Pgc1a in the siRNA treated brown mature adipocytes.*p=0.0251, ***p= 0.0005, *p=0.0004, ***p=0.0373. n=4 C, 4 KO. F. Western blot of siACLY treated brown mature adipocytes, chromatin and WCL (whole cell lysate). n=3 samples. G. Western blot of ACLY inhibitor (BMS-303141) treated brown mature adipocytes, chromatin and WCL (whole cell lysate). n=2 samples. Panels B-E: grey bar (NT), orange bar (siAcly). Panels B, C: black line (NT), orange line (siAcly). Data are mean ± s.e.m. Statistical analysis unpaired two-tailed Student’s t-test.
Extended Fig. 5.
Extended Fig. 5.. Induced ACLY loss triggers the Integrated Stress Response and Changes in Mitochondrial Processes.
A. Body weight of the AclyBATiKO male mice. n=8 C, 8 KO. B. Adipose tissue weights of the AclyBATiKO male mice. ****p=<0.0001. n=8 C, 8 KO. C. Lean tissue weights of the AclyBATiKO male mice. n=8 C, 8 KO. D. RT-PCR analysis of iBAT from AclyBATiKO male mice and littermate controls. **p=0.0020, **p=0.0031, *p=0.0205, ***p<0.0001, *p=0.0380, *p=0.0254 n=5 C, 5 KO. F. Western blot of the AclyBATiKO male mice. N=4 individual mice. Panels A-D: grey bar (C), orange bar (AclyBATiKO). Data are mean ± s.e.m. Statistical analysis unpaired two-tailed Student’s t-test.
Extended Fig. 6.
Extended Fig. 6.. ACLY’s Role in Mitigating Stress is Linked to Dietary Carbohydrates.
A. RT-PCR analysis of Atf4 in the AclyBATKO mice 2 and 4 week of age. *p=0.0496. 2W: n=5 C, 5 KO; 4W: n=6 C, 6 KO. B. RT-PCR analysis of Ucp1 in the AclyBATKO mice 2 and 4 week of age. *p=0.0106. C. RT-PCR analysis of Acss2 in the AclyBATKO mice 2 and 4 week of age. *p=0.0110, p*=0.0110, *p=0.0145. D. RT-PCR analysis of Fasn in the AclyBATKO mice 2 and 4 week of age.****p<0.0001, ***p=0.0001. E. RT-PCR analysis of Chrebpa in the AclyBATKO mice 2 and 4 week of age. ****p<0.0001, ****p<0.0001. F. RT-PCR analysis of Chrebpb in the AclyBATKO mice 2 and 4 week of age. *p=0.0434, *p=0.0434, ****p<0.0001, ****p<0.0001. Panels A-F: grey bar (C), orange bar (AclyBATKO). Data are mean ± s.e.m. Group differences determined via one-tailed ANOVA with Tukey’s post hoc.
Extended Fig. 7.
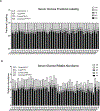
Extended Fig. 7.. ACLY Prevents TCA Cycle Overload During Thermogenesis.
A. Serum glucose fractional labeling AclyBATKO and Acly,FasnBATKO mice. B. Serum glucose relative abundance AclyBATKO and Acly,FasnBATKO mice. 15 minutes: AclyBATKO n=6C, 9 KO; Acly,FasnBATKO n=5C, 5 KO. 30 minutes: AclyBATKO n=6C, 9 KO; Acly,FasnBATKO n=4, 5 KO.
Extended Fig. 8.
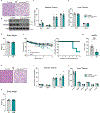
Extended Fig. 8.. FasnBATKO male and female mice.
A. Representative H&E of the iBAT from FasnBATKO male and female mouse and littermate control. Scale bar 50um. Has been confirmed in n=3 males, n=5 females. B. Adipose tissue weights of the FasnBATKO male mice. n=6 C, 6 KO. Adipose tissue weights of the FasnBATKO female mice. n=6 C, 6 KO. C. Western blot of the FasnBATKO male and female mice. D. Rectal temperatures of the FasnBATKO male mice and littermate controls during cold exposure (4°C). n=7 C, 7 KO. Rectal temperatures of the FasnBATKO female mice and littermate controls during cold exposure (4°C). n=8 C, 6 KO. E. Mitochondria/Nuclear DNA ratio in the FasnBATKO mice BAT. n=6 C, 6 KO. F. CoQ levels in the FasnBATKO mice BAT. n=9 C, 8 KO. Panels B, E, F: grey bars (C), blue bars (FasnBATKO). Panel D: black lines (C), blue lines (FasnBATKO). Data are mean ± s.e.m. Statistical analysis unpaired two-tailed Student’s t-test.
Extended Fig. 9.
Extended Fig. 9.. Acly,Acss2BATDKO male and female mice.
A. Representative H&E of the iBAT from Acly,Acss2BATKO male mouse and littermate control. Scale bar 50um. Clear consistent phenotype, confirmed n=6 mice. B. Western blot of the Acly,Acss2BATKO male mouse BAT. C. Adipose tissue weights of the Acly,Acss2BATKO male mice. *p=0.0291. n=5 C, 6 KO. D. Lean tissue weights of the Acly,Acss2BATKO male mice. n=5 C, 6 KO. E. Body weight of the Acly,Acss2BATKO male mice. n=5 C, 6 KO. F. Rectal temperatures of the Acly,Acss2BATKO male mice and littermate controls during cold exposure (4°C), left. “Survival curve”, how many mice remain in the cold over the time course of experiment, right. n=7 C, 8 KO. G. Mitochondria/Nuclear DNA ratio in the Acly,Acss2BATKO male mice BAT. **p=0.0060. n=5 C, 6 KO. H. Representative H&E of the iBAT from Acly,Acss2BATKO female mouse and littermate control. Scale bar 50um. Clear consistent phenotype, confirmed in n=4 mice. I. Adipose tissue weights of the Acly,Acss2BATKO female mice. n=6 C, 5 KO. J. Lean tissue weights of the Acly,Acss2BATKO female mice. n=6 C, 5 KO. K. Body weight of the Acly, Acss2BATKO female mice. n=6 C, 5 KO. Panels C-E,G: grey bars (C), teal (Acly,Acss2BATKO) males. Panels I-K: grey bars (C), blue bars (Acly,Acss2BATKO) females. Panels F: black lines (C), teal lines (Acly,Acss2BATKO). Data are mean ± s.e.m. Statistical analysis unpaired two-tailed Student’s t-test.
Extended Fig. 10.
Extended Fig. 10.. BAT Acly;Fasn Double Knockout Rescues Thermogenesis Independent of DNL and Prevents ISR.
A. Body weight of the Acly,FasnBATKO male mice. n=5 C, 5 KO. B. Adipose tissue weights of the Acly,FasnBATKO male mice. n=5 C, 5 KO. C. Relative labeled abundance of palmitate in BAT of AclyBATKO,Acss2BATKO(n=11C, 5KO and 5KO), FasnBATKO(n=6C, 6KO),Acly/FasnBATKO(n=6C, 6KO)mice and littermate controls. *p=0.0404, ***p= 0.0007, **p=0.0035. D. Representative H&E of the iBAT from AclyBATiKO and Acly,FasnBATiKO male mouse and littermate control. Scale bar 50um. Has been confirmed in n=3 mice each. E. Body weight of the Acly,FasnBATiKO male mice. n=6 C, 6 KO. F. Adipose tissue and lean tissues weights of the Acly,FasnBATiKO male mice. n=6 C, 6 KO. G. Principal Component Analysis (PCA) plot of RNAseq from AclyBATiKO and Acly,FasnBATiKO male mouse and littermate controls. H. Heat map relative abundance of Immune Response genes in RNAseq of AclyBATiKO and Fasn,AclyBATiKO BAT. Panel G-H: light grey (C), orange bar (AclyBATiKO), dark grey (C), light purple bar (Fasn,AclyBATiKO). Data are mean ± s.e.m. Statistical analysis unpaired two-tailed Student’s t-test. Group differences determined via one-tailed ANOVA with Tukey’s post hoc.
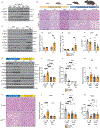
Fig. 1.
Fig. 1.. ACLY loss in Brown Fat Causes Tissue Whitening, Cold Intolerance and Lipid Metabolic Reprogramming in Male Mice.
A. Model of futile FAS-FAO cycling in BAT and the role of ACLY. Created in BioRender. G, D. (2024) BioRender.com/y99u456. B. Representative image of the interscapular BAT from an AclyBATKO mouse and littermate control at 10 weeks old. C. Representative H&E of the iBAT from AclyBATKO male mouse and littermate control. Scale bar 50um. Clear consistent phenotype across n=4 mice. D. Western blot corresponding to the images in (B) and (C). n=3 mice. E. Rectal temperatures of the AclyBATKO male mice and littermate controls during cold exposure (4°C). n=3 C, 6 KO. F. Representative H&E of the iBAT from Acss2BATKO male mouse and littermate control. Scale bar 50um. Consistent phenotype across n=3 mice. G. Western blot of the Acss2BATKO. n=3 mice. H. Rectal temperatures of the Acss2BATKO male mice and littermate controls during cold exposure (4°C). n=5 C, 5 KO. I. RT-PCR analysis of mitochondria and peroxisome FAO genes in BAT.**** p<0.0001, ***p=0.0001, ***p=0.0003, **p=0.0017, ****p<0.0001, ****p=<0.0001, *p=0.0268, ***p=0.0003. n=6–8 C, 6–8 KO. Ecl1, ehhadh, 2,4drc (n=6C, 6KO, mice batch 1); Cpt1a, Cpt1b, Pmp70, Cpt2, Cact, Crat (n=8C, 8KO, mice batch 2). J. RT-PCR analysis of elongases. **p= 0.0035. n=6 C, 6 KO. K. RT-PCR analysis of desaturases. **p=0.0049, *p=0.0120. n=6 C, 6 KO. L. RT-PCR analysis of TG synthesis pathway genes.***p= 0.0004, **p=0.0016. n=6 C, 6 KO. Data in panels C-F has been replicated 3 times. Data are mean ± s.e.m. Statistical analysis unpaired two-tailed Student’s t-test.
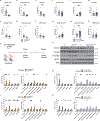
Fig. 2.
Fig. 2.. The BAT Mitochondria Network and Thermogenic Program Requires ACLY.
A. Western blot of UCP1 and representative ETC proteins in BAT lysates prepared from control and AclyBATKO mice. B. RT-PCR analysis of Ucp1 in BAT. ****p<0.0001. n=8 C, 8 KO. C. CoQ levels in BAT. ****p<0.0001. n=7 C, 7 KO. D. RT-PCR analysis of Cycs in BAT. ****p<0.0001. n=8 C, 8 KO. E. BAT Mitochondria/Nuclear DNA ratio. ****p<0.0001. n=8 C, 8 KO. F. Lipidomics analysis of cardiolipin (CL), phosphatidylglycerol (PG), phosphatidylinositol (PI) in BAT. **p=0.0036, ***p=0.0004, *p=0.0121.n=9 C, 14 KO. G. Lipidomics analysis of phosphatidylcholine (PC), phosphatidylethanolamine (PE), phosphatidylserine (PS), in BAT. ***p=0.0004, **p=0.0019, ****p<0.0001. n=9 C, 14 KO. H. Representative electron micrographs from the BAT of control and AclyBATKO mice; top: scale bar = 0.5um, bottom: scale bar = 200nm. I. RT-PCR analysis of core thermogenic genes in BAT. *p=0.0111, ****p<0.0001, **p=0.0033, **p=0.0053, ****p<0.0001, *p=0.0181, ****p<0.0001, *p=0.0088, **p=0.0025, **p=0.0022, *p=0.0305. n=8 C, 8 KO. Data are mean ± s.e.m. Statistical analysis unpaired two-tailed Student’s t-test.
Fig. 3.
Fig. 3.. Beige Adipocyte Formation Also Requires ACLY.
A. Representative H&E of the subcutaneous adipose tissue (SAT) from AclyFATKO male mice and littermate controls housed at 6°C for 4 weeks. Top scale bars, left to right are 500uM and 1000uM. Bottom scale bars, 50um. Consistent result across n=5 animals. B. Western blot of UCP1 and representative ETC proteins corresponding to (A). n=4mice. C. Representative immunofluorescent staining of UCP1 and DAPI in the SAT from AclyFATKO male mice (C3, C4) and littermate controls (C1, C2) housed at 6°C for 4 weeks. Scale bars, 50um. D. Mitochondria/Nuclear DNA ratio in the SAT from AclyFATKO male mice and littermate controls housed at 6°C for 4 weeks. **p=0.0070. n=8 C, 8 KO. E. RT-PCR analysis of SAT from AclyFATKO male mice and littermate controls housed at 6°C for 4 weeks. ****p<0.0001, ***p=0.0004, ****p<0.0001, ****p<0.0001, **p=0.0026, ***p=0.0002, ****p<0.0001, ****p<0.0001, **p=0.0024 n=7 C, 8 KO. Panels D: grey bar (Control), orange bar (AclyFATKO). Data are mean ± s.e.m. Statistical analysis unpaired two-tailed Student’s t-test.
Fig. 4.
Fig. 4.. Induced ACLY loss triggers the Integrated Stress Response.
A. Representative H&E of the BAT from AclyBATiKO male mouse and littermate control. Scale bar 50um. Consistent result across n=3 mice. B. Corresponding Western blot of the AclyBATiKO male mice. C-F. Volcano plots generated from bulk RNA-sequencing that show differential gene expression (log2(Fold Change) between control and induced Acly KO BAT for the following groups of genes: C. Respiratory Chain genes. D. Lipid Metabolism genes. E. Immune Response genes. F. Integrated stress response (ISR) genes. Panels C-F are scaled to highlight specific pathways.
Fig. 5.
Fig. 5.. ACLY’s Role in Mitigating Stress is Linked to Dietary Carbohydrates.
A. Western blot form WT BAT lysates from 1- to 5-week-old mice weaned onto a standard laboratory diet. n=2 mice for each timepoint. B. Representative H&E stains of BAT from AclyBATKO mice and littermate controls from P2 to 8–12-week-old mice. Scale bar 50um. n=2 mice each timepoint. Created in BioRender. G, D. (n.d.) BioRender.com/q54z563. C. Western blot of the iBAT from AclyBATKO mice and littermate controls at 2 and 4 weeks of age. D. RT-PCR analysis of Ddit3 in the AclyBATKO mice 2 and 4 week of age. **p=0.0028. 2W: n=5 C, 5 KO; 4W: n=6 C, 6 KO. E. RT-PCR analysis of Trib3. **p=0.0047. 2W: n=5 C, 5 KO; 4W: n=6 C, 6 KO. F. Mitochondria/Nuclear DNA ratio in iBAT from AclyBATKO mice and littermate controls at 2 and 4 weeks of age. *p=0.0301. 2W: n=5 C, 5 KO; 4W: n=5 C, 6 KO. G. Western blot of the iBAT from AclyBATKO mice and littermate controls on carb. rich or carb. free diet. H. Representative H&E of the iBAT from AclyBATKO mice and littermate controls on carb. rich or carb. free diet. Scale bar 50um. I. iBAT weight from AclyBATKO mice and littermate controls on carb. rich or carb. free diet. ****p<0.0001, **p=0.0023. Carb. rich: n=9 C, 9 KO; carb. free: n=9 C, 9 KO. J. RT-PCR analysis of Acly in the iBAT from AclyBATKO mice and littermate controls on carb. rich or carb. free diet. ****p<0.0001. Carb. rich: n=8 C, 9 KO; carb. free: n=9 C, 8 KO. K. RT-PCR analysis of Atf4. *p= 0.0319. L. RT-PCR analysis of Ddit3. ****p< <0.0001. M. RT-PCR analysis of Ucp1. ****p< <0.0001. N. Mitochondria/Nuclear DNA ratio in iBAT from AclyBATKO mice and littermate controls on carb. rich or carb. free diet. ****p< <0.0001, *p= 0.0409, **p= 0.0070. Carb. rich: n=9 C, 9 KO; carb. free: n=9 C, 8 KO. Panels I-N: grey bar (C) carb. rich diet, orange bar left (AclyBATKO) carb.rich diet; dark grey bar (C) carb. free diet, orange bar right (AclyBATKO) carb. free diet. Data are mean ± s.e.m. Group differences determined via one-tailed ANOVA with Tukey’s post hoc.
Fig. 6.
Fig. 6.. ACLY Prevents TCA Cycle Overload During Thermogenesis.
A-F. Measurements of the indicated acly-CoA species in the BAT of control and AclyBATKO mice. n=13 C, 15 KO. A. Acetyl-CoA. ****p <0.0001. B. Malonyl-CoA. ***p= 0.0004. C. CoASH. ***p= 0.0002. D. Butyryl-CoA. *p= 0.0165. E. Succinyl-CoA. *p= 0.0105. F. HMG-CoA. G. Schematic of [U-13C]Glucose tracing experiment. H. Western blot of the AclyBATKO and Acly,FasnBATKO male mice. n=3 mice for each condition. I-J. Labeled ion counts for metabolites in the AclyBATKO mice BAT at 15 minutes (I) and 30 minutes (J). 15min: Left ***p= 4e-04, *p= 0.0256, *p= 0.0176, *p= 0.012.Right *p= 0.0176, **p= 0.00759, *p= 0.0176, *p= 0.0256. n=6C, 9 KO. 30min:Left **p= 0.0016, ***p= 4e-04, ***p= 4e-04, ***p= 4e-04. Right *p= 0.012, ***p= 4e-04, *p= 0.036. K-P. Measurements of the indicated acly-CoA species in the BAT of control and Acly,FasnBATKO mice. n=13 C, 16 KO. K. Acetyl-CoA. L. Malonyl-CoA. ***p= 0.0001. M. CoASH. N. Butyryl-CoA. *p= 0.0226. O. Succinyl-CoA.***p= 0.0001. P. HMG-CoA. Q-R. Labeled ion counts for metabolites in the Acly,FasnBATKO mice BAT at 15 minutes (Q) and 30 minutes (R). n=4C, 5 KO. 15min:Left **p= 0.00794. Right **p= 0.00794, **p= 0.00794, **p= 0.00794, *p= 0.0317, *p= 0.0159. 30min:Left *p= 0.0159, *p= 0.0317, *p= 0.0159, *p= 0.0159, *p= 0.0159. Right *p= 0.0317. Panels I, J, Q, R: Statistical analysis is two-sample Wilcoxon. Data are mean ± s.e.m. Group differences determined via one-tailed ANOVA with Tukey’s post hoc.
Fig. 7.
Fig. 7.. BAT Acly;Fasn Double Knockout Rescues Thermogenesis Independent of DNL and Prevents ISR.
A. Representative H&E of the iBAT from Fasn,AclyBATKO male mouse and littermate control. Scale bar 50um. Consistent in n=4 mice. B. Tissue weights (iBAT) from Fasn,AclyBATKO mice and littermate controls. n=5 C, 5 KO. C. Western blot of the Fasn,AclyBATKO. D. Mitochondria/Nuclear DNA ratio in iBAT from Fasn,AclyBATKO mice and littermate controls. n=6 C, 6 KO. E. CoQ levels in the Fasn,AclyBATKO mice BAT. n=5 C, 5 KO. F. RT-PCR analysis the iBAT from Fasn,AclyBATKO mice and littermate controls. n=6 C, 6 KO. G. Rectal temperatures of the Fasn,AclyBATKO male mice and littermate controls during cold exposure (4°C). n=7 C, 7 KO. H. D2O labeling of newly synthesized palmitate in the AclyBATKO(n=5,*p= 0.0109), Acly;Acss2BATKO(n=5,**p= 0.0053), FasnBATKO(n=6,**p= 0.0068), Fasn;AclyBATKO(n=6,**p= 0.0022) mice BAT and their littermates(n=23). I. Western blot of the AclyBATiKO and Fasn,AclyBATiKO BAT. n=3 mice each condition. J. Heat map relative abundance of ISR genes in RNAseq of AclyBATiKO and Fasn,AclyBATiKO BAT. Data are mean ± s.e.m. Statistical analysis unpaired two-tailed Student’s t-test. Group differences determined via one-tailed ANOVA with Tukey’s post hoc.
Fig. 8.
Fig. 8.. Model of futile FAS-FAO cycling in BAT and the role of ACLY and FASN.
(left) Depiction of normal futile FAS-FAO cycling in active BAT. (middle) ACLY is essential for FAS-FAO cycling in the BAT of mildly cold mice, where it promotes citrate efflux from mitochondria and into de novo lipid synthesis to reduce pressure on the TCA cycle and facilitate efficient metabolic flux. In the absence of ACLY, increased carbon flux into the mitochondria from both FFAs and glucose causes TCA cycle overload which activates the integrated stress response and downregulates UCP1 expression. Loss of UCP1 may additionally or independently cause further mitochondrial stress. (right). Doubly deleting Acly and Fasn restores metabolic homeostasis by unlocking an alternative metabolic program defined by higher-than-normal malonyl-CoA. Because ACLY is deficient in this context, the high malonyl-CoA must be generated from an alternative source of acetyl-CoA, and the high malonyl-CoA levels would depressurize the TCA cycle by attenuating flux from FAO through its classic mechanism of allosterically inhibiting fatty acid uptake into mitochondria (via CTP1). High succinyl-CoA levels and altered glucose flux in the double knockout BAT suggests additional metabolic reprogramming steps may also help reestablish homeostasis. Created in BioRender. G, D. (2024) BioRender.com/h38h345.

References

    1. Cannon B & Nedergaard J Brown adipose tissue: function and physiological significance. Physiol Rev 84, 277–359, doi:10.1152/physrev.00015.2003 (2004). - DOI - PubMed
    1. Cohen P & Kajimura S The cellular and functional complexity of thermogenic fat. Nat Rev Mol Cell Biol 22, 393–409, doi:10.1038/s41580-021-00350-0 (2021). - DOI - PMC - PubMed
    1. Jung SM, Sanchez-Gurmaches J & Guertin DA Brown Adipose Tissue Development and Metabolism. Handb Exp Pharmacol 251, 3–36, doi:10.1007/164_2018_168 (2019). - DOI - PMC - PubMed
    1. Sanchez-Gurmaches J, Hung CM & Guertin DA Emerging Complexities in Adipocyte Origins and Identity. Trends Cell Biol 26, 313–326, doi:10.1016/j.tcb.2016.01.004 (2016). - DOI - PMC - PubMed
    1. Seki T et al. Brown-fat-mediated tumour suppression by cold-altered global metabolism. Nature 608, 421–428, doi:10.1038/s41586-022-05030-3 (2022). - DOI - PMC - PubMed

LinkOut - more resources