. 2024 Oct 14;22(1):935.
doi: 10.1186/s12967-024-05459-2.

CTPAD: an interactive web application for comprehensive transcriptomic profiling in allergic diseases

Affiliations

CTPAD: an interactive web application for comprehensive transcriptomic profiling in allergic diseases

Suizi Zhou et al. J Transl Med. .

Abstract

Background: Allergic diseases are systemic chronic inflammatory diseases associated with multiorgan damage and complex pathogenesis. Several studies have revealed the association of gene expression abnormalities with the development of allergic diseases, but the biomedical field still lacks a public platform for comprehensive analysis and visualization of transcriptomic data of allergic diseases.

Objective: The aim of the study is to provide a comprehensive web tool for multiple analysis in allergic diseases.

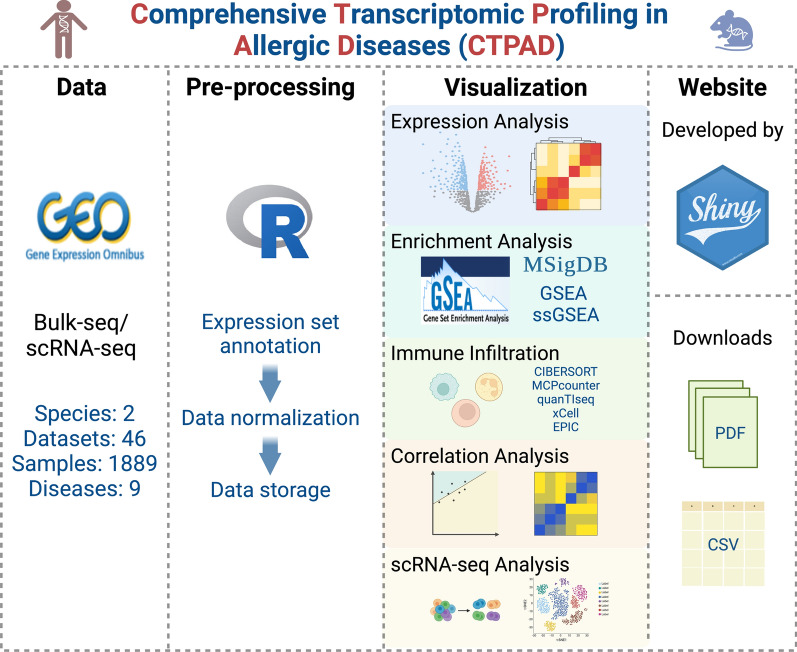
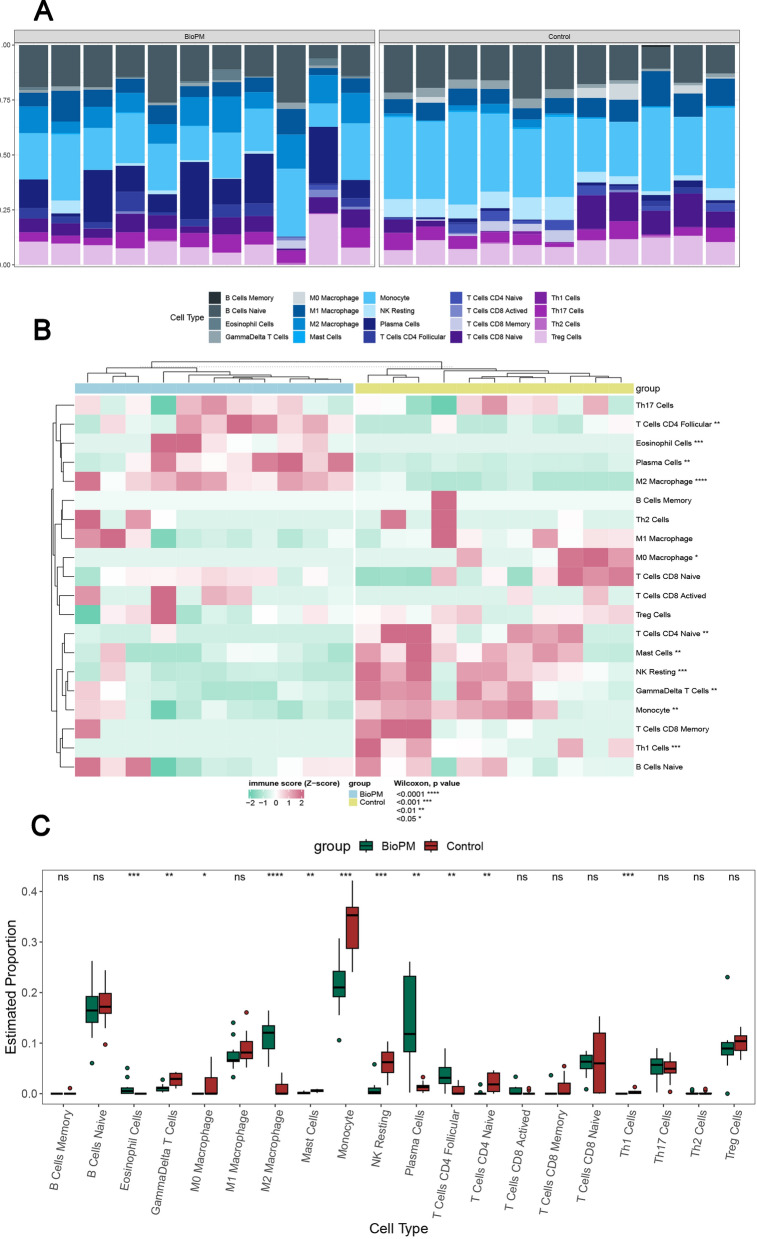
Methods: We retrieved and downloaded human and mouse gene expression profile data associated with allergic diseases from the Gene Expression Omnibus (GEO) database and standardized the data uniformly. We used gene sets obtained from the MSigDB database for pathway enrichment analysis and multiple immune infiltration algorithms for the estimation of immune cell proportion. The basic construction of the web pages was based on the Shiny framework. Additionally, more convenient features were added to the server to improve the efficiency of the web pages, such as jQuery plugins and a comment box to collect user feedback.

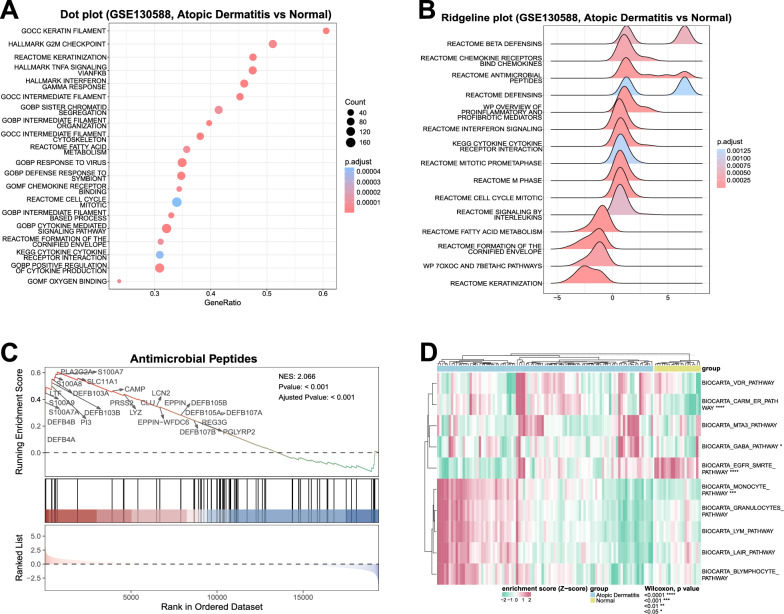
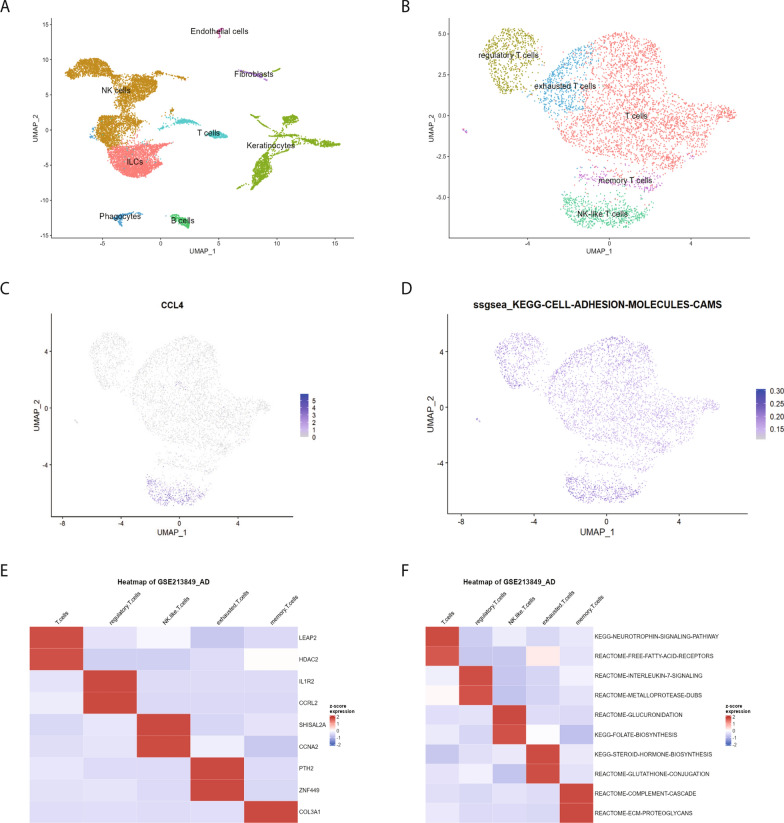
Results: We developed CTPAD, an interactive R Shiny application that integrates public databases and multiple algorithms to explore allergic disease-related datasets and implement rich transcriptomic visualization capabilities, including gene expression analysis, pathway enrichment analysis, immune infiltration analysis, correlation analysis, and single-cell RNA sequencing analysis. All functional modules offer customization options and can be downloaded in PDF format with high-resolution images.

Conclusions: CTPAD largely facilitates the work of researchers without bioinformatics background to enable them to better explore the transcriptomic features associated with allergic diseases. CTPAD is available at https://smuonco.shinyapps.io/CTPAD/ .

Keywords: Allergic diseases; Bioinformatics; Gene; Transcriptomic profiling; Visualization.


Conflict of interest statement

The authors declare no potential conflicts of interest.

Figures

Fig. 1
Fig. 1
Workflow diagram presenting data collection, preprocessing, and web tool construction for the CTPAD web tool (Created with BioRender.com)
Fig. 2
Fig. 2
Volcano plot and heatmap visualization results based on DEG analysis results in the Expression Analysis module. A Volcano plot showing the names of significantly up- and downregulated differentially expressed genes in the GSE5667 dataset. B Heatmap depicting gene expression between atopic dermatitis (AD) and controls, with red representing upregulation and green representing downregulation, where p values were calculated by the t test built into the limma package. *p < 0.05, **p < 0.01, ***p < 0.001, ****p < 0.0001
Fig. 3
Fig. 3
Multiple visualization results of pathway enrichment analysis in the Enrichment Analysis module. A GSEA enrichment results between the atopic dermatitis group and the normal group. The scatter diagram shows the top 20 gene sets sorted according to the p-adjusted value. B Expression distribution of core enriched genes in the set of CP genes enriched by GSEA between the atopic dermatitis group and the normal group. The x-axis is log2-fold of the change in expression of core enriched genes in the enrichment pathway, > 0 indicates upregulated expression, and < 0 indicates downregulated expression. C GSEA plot showing the enrichment of the REACTOME_ANTIMICROBIAL_PEPTIDES pathway in the atopic dermatitis group compared to the normal group. The top 25 genes in the gene set that contributed most to the GSEA enrichment score are labelled in the figure. D Differences in ssGSEA enrichment scores between the atopic dermatitis group and the normal group; red represents upregulation, and green represents downregulation. p values were calculated by the Wilcoxon test. *p < 0.05, **p < 0.01, ***p < 0.001, ****p < 0.0001
Fig. 4
Fig. 4
Multiple visualization results for immune infiltration analysis in the Immune Infiltration module. A Overview of the different immune cell infiltration proportions between the BioPM-exposed and control groups. B Heatmap showing the difference in immune infiltration scores between the BioPM-exposed and control groups. C Boxplot visualizing the difference in the difference in the percentage of immune cell infiltration. p values were calculated by the Wilcoxon test. BioPM: biological particulate matter. *p < 0.05, **p < 0.01, ***p < 0.001, ****p < 0.0001
Fig. 5
Fig. 5
Two visualizations of correlation analysis in the Correlation Analysis module. A Scatter diagram showing a positive correlation between MUC5B mRNA expression and GOBP_EPIDERMIS_DEVELOPMENT pathway ssGSEA score (R = 0.6, p < 0.001). B Correlation heatmap showing the results of correlation analysis between the 5 genes; green represents a positive correlation, and purple represents a negative correlation. R is the Spearman correlation coefficient. *p < 0.05, **p < 0.01, ***p < 0.001, ****p < 0.0001
Fig. 6
Fig. 6
Visualizations of Single-cell RNA Sequencing Analysis Module. A, B Cluster plot displaying distinct cell subtype clusters following UMAP dimensionality reduction. Each point represents an individual cell colored according to its assigned cluster identity. C, D Feature plot illustrating the expression patterns of genes of interest and pathway activation profiles using the ssGSEA algorithm. E, F Heatmap showing the expression levels of genes of interest and pathway activation profiles using the ssGSEA algorithm. ssGSEA: single sample Gene Set Enrichment Analysis; UMAP: Uniform Manifold Approximation and Projection
Fig. 7
Fig. 7
Validation of allergic rhinitis-related differentially expressed genes via IHC. IHC images and corresponding quantification demonstrate the protein expression levels of BCL2L15, MUC2, and SLC7A1 in the inferior nasal concha mucosa of control and AR groups. BCL2L15 and MUC2 show significant upregulation in the AR group (p < 0.01), while SLC7A1 exhibits elevated expression without reaching statistical significance (p = 0.0777). The percentage of positive area was calculated by dividing the stained area by the total area of a fixed rectangular frame. Significance was determined using the Wilcoxon rank sum test. AR: Allergic Rhinitis; IHC: Immunohistochemistry. *p < 0.05, **p < 0.01, ***p < 0.001, ****p < 0.0001

References

    1. Breiteneder H, Peng Y-Q, Agache I, Diamant Z, Eiwegger T, Fokkens WJ, et al. Biomarkers for diagnosis and prediction of therapy responses in allergic diseases and asthma. Allergy. 2020;75:3039–68. 10.1111/all.14582. - PMC - PubMed
    1. Samitas K, Carter A, Kariyawasam HH, Xanthou G. Upper and lower airway remodelling mechanisms in asthma, allergic rhinitis and chronic rhinosinusitis: the one airway concept revisited. Allergy. 2018;73:993–1002. 10.1111/all.13373. - PubMed
    1. Barbarot S, Auziere S, Gadkari A, Girolomoni G, Puig L, Simpson EL, et al. Epidemiology of atopic dermatitis in adults: results from an international survey. Allergy. 2018;73:1284–93. 10.1111/all.13401. - PubMed
    1. Fokkens WJ, Lund VJ, Hopkins C, Hellings PW, Kern R, Reitsma S, et al. European position paper on rhinosinusitis and nasal polyps 2020. Rhinology. 2020;58:1–464. 10.4193/Rhin20.600. - PubMed
    1. Zheng T, Yu J, Oh MH, Zhu Z. The atopic march: progression from atopic dermatitis to allergic rhinitis and asthma. Allergy Asthma Immunol Res. 2011;3:67–73. 10.4168/aair.2011.3.2.67. - PMC - PubMed

LinkOut - more resources