. 2024 Oct 14;25(1):271.
doi: 10.1186/s13059-024-03416-2.

SDePER: a hybrid machine learning and regression method for cell-type deconvolution of spatial barcoding-based transcriptomic data

Affiliations

SDePER: a hybrid machine learning and regression method for cell-type deconvolution of spatial barcoding-based transcriptomic data

Yunqing Liu et al. Genome Biol. .

Abstract

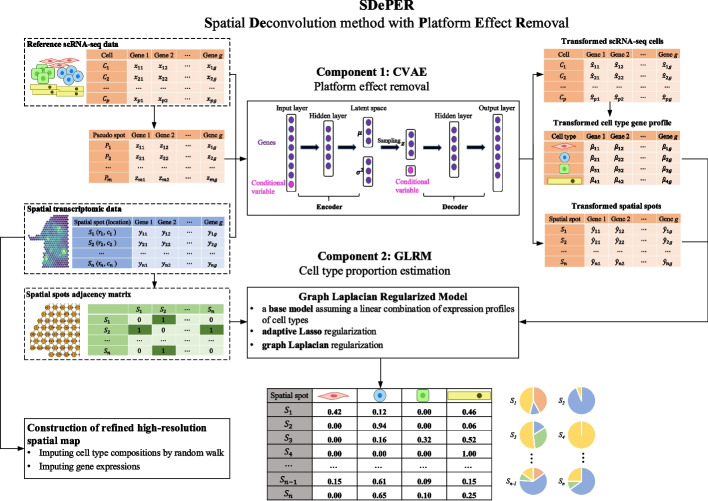
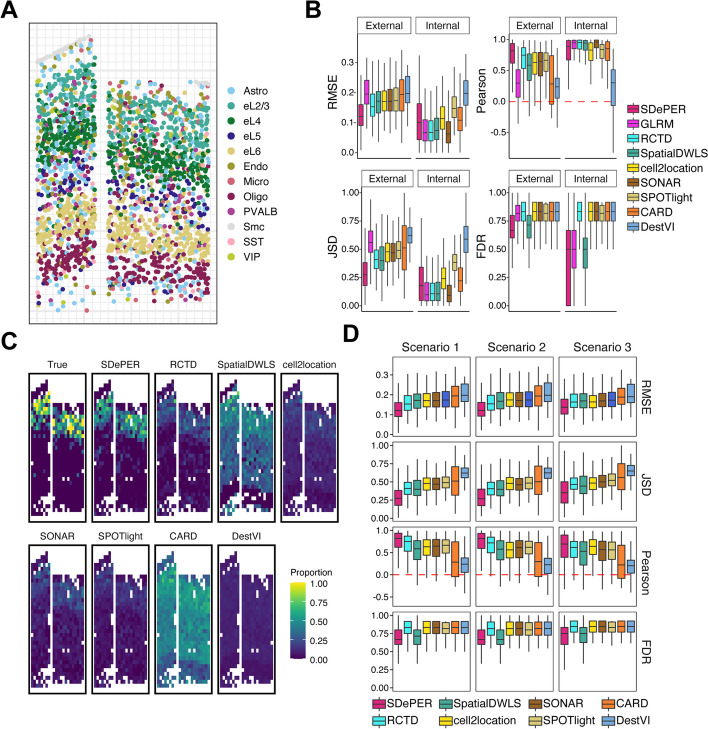
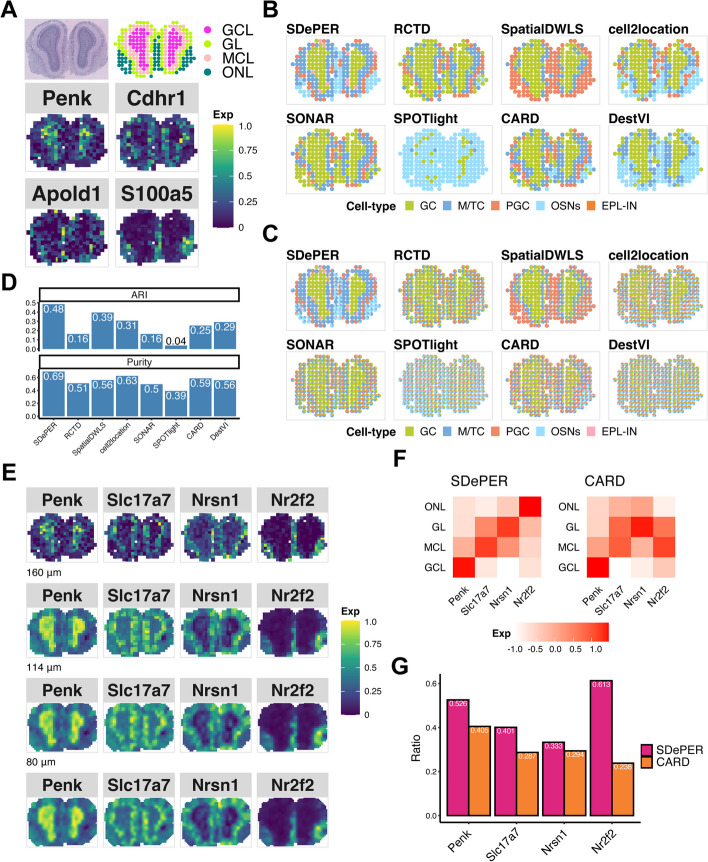
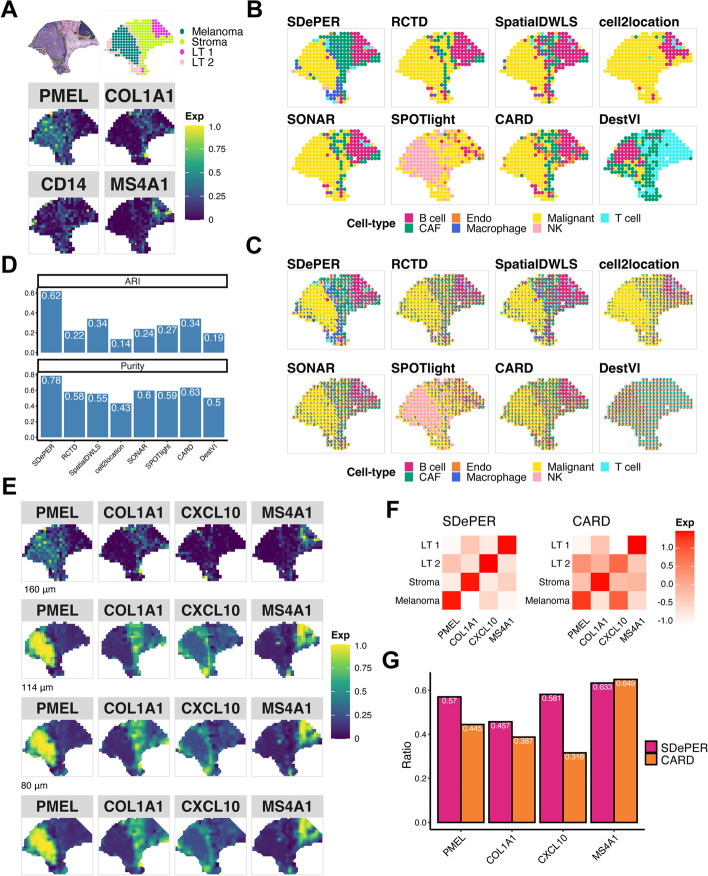
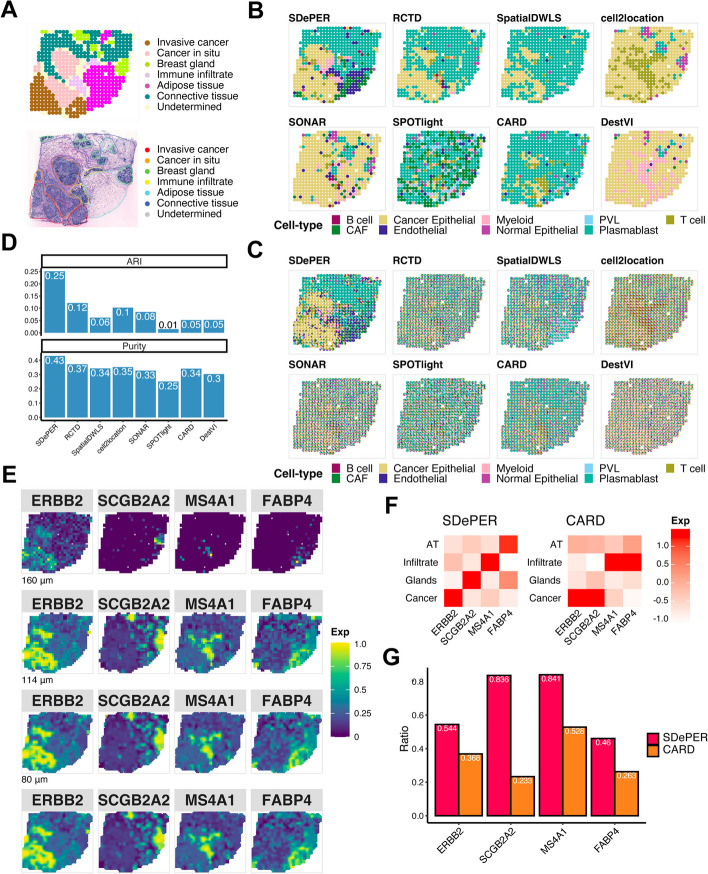
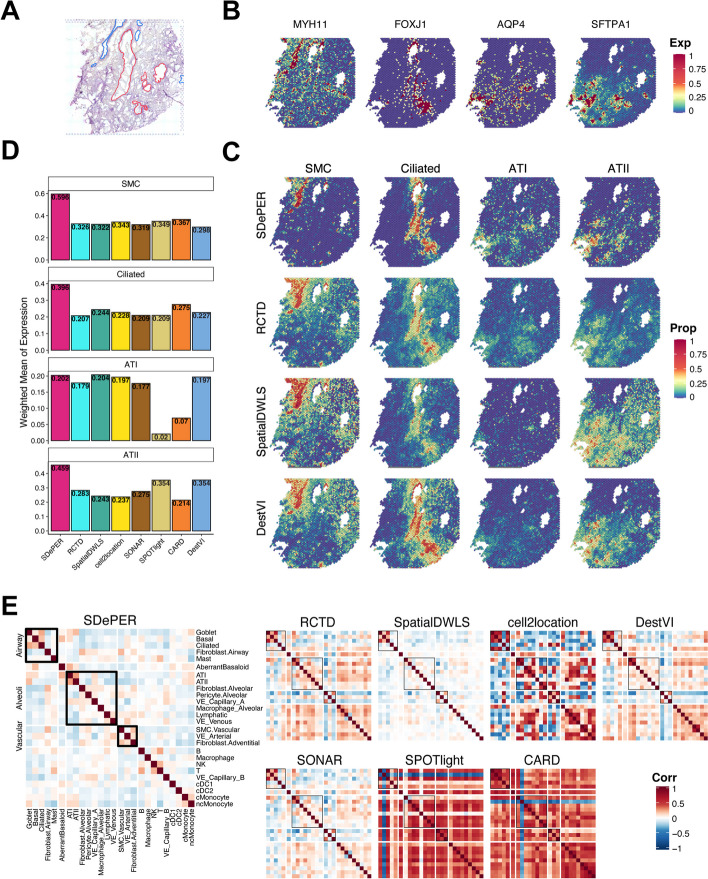
Spatial barcoding-based transcriptomic (ST) data require deconvolution for cellular-level downstream analysis. Here we present SDePER, a hybrid machine learning and regression method to deconvolve ST data using reference single-cell RNA sequencing (scRNA-seq) data. SDePER tackles platform effects between ST and scRNA-seq data, ensuring a linear relationship between them while addressing sparsity and spatial correlations in cell types across capture spots. SDePER estimates cell-type proportions, enabling enhanced resolution tissue mapping by imputing cell-type compositions and gene expressions at unmeasured locations. Applications to simulated data and four real datasets showed SDePER's superior accuracy and robustness over existing methods.


Conflict of interest statement

The authors declare that they have no competing interests.

Figures

Fig. 1
Fig. 1
Schematic overview of SDePER. SDePER performs cell-type deconvolution of ST data in a two-step fashion. In the first step, conditional variational autoencoder (CVAE) takes three datasets as input: real ST data, reference scRNA-seq data, and pseudo-spot data generated using the reference scRNA-seq data. Using the trained encoder and decoder under the two conditions (ST and scRNA-seq), real ST data is transformed into the same space as scRNA-seq data and pseudo-spot data. The transformed real ST data and cell type-specific expression profiles are then used to fit the graph Laplacian regularized model (GLRM) with penalties for sparsity and across-spot spatial correction in cell-type compositions. The estimated cell-type compositions from GLRM can be further used to impute for cell-type compositions and gene expression at unmeasured locations in the original spatial map to construct new spatial map at arbitrarily higher resolution
Fig. 2
Fig. 2
Performance evaluation and comparison using simulation studies. A Coarse-graining procedure to simulate ST data (581 spots) with ground truth. B Demonstration of the impact of platform effects on method performance: boxplots show the median (center line), interquartile range (hinges), and 1.5 times the interquartile (whiskers) of RMSE, JSD, Pearson’s correlation, and FDR across all 581 spots using external scRNA-seq reference and internal single-cell level spatial reference. C The proportion of L2/3 excitatory neurons in the simulated spots. D Boxplots show the median (center line), interquartile range (hinges), and 1.5 times the interquartile (whiskers) of RMSE, JSD, Pearson’s correlation, and FDR across 581 spots using different scRNA-seq reference: scenario 1: scRNA-seq reference with matched cell type; scenario 2: one missing cell type in scRNA-seq reference; scenario 3: one added irrelevant cell type in scRNA-seq reference
Fig. 3
Fig. 3
Performance evaluation and comparison using MOB dataset. A H&E staining of MOB (top-left), annotated regions (top-right GCL: granule cell layer; MCL: mitral cell layer; GL: glomerular layer; ONL: olfactory nerve layer) and expression pattern of cell-type-specific marker genes for dominant cell types (bottom, Penk for GC, Cdhr1 for mitral and tufted cell (M/TC), Apold1 for periglomerular cell (PGC), and S100a5 for olfactory sensory neurons (OSNs)). B Visualization of inferred dominant cell type in each spot (EPL-IN: external plexiform layer interneuron). C Spatial scatter pie chart of estimated cell-type composition within each spot. D Comparing deconvolution methods using ARI (left) and purity (right). E Expression patterns of the corresponding layer-specific marker genes and imputed expression at three different resolution levels: 160 μm (about 64% of original size), 114 μm (about 32% of original size), 80 μm (about 16% of original size). F Heatmap showing average imputed expression of region-specific marker genes at 80 μm level within each annotated region for SDePER and CARD. G Bar plot showing the ratio of average layer-specific marker gene expression in the corresponding layer among all layers
Fig. 4
Fig. 4
Performance evaluation and comparison using melanoma dataset. A H&E staining of melanoma (top left, melanoma (black), stroma (red), lymphoid tissue (yellow)), annotated regions (top right, LT lymphoid tissue) based on BayesSpace and expression pattern of cell-type-specific marker genes for dominant cell types (bottom, PMEL for malignant melanoma regions, COL1A1 for fibroblast in stroma regions, CD14 for macrophage, and MS4A1 for B cells). B Visualization of inferred dominant cell type in each spot (CAF cancer-associated fibroblasts, Endo endothelial, NK natural killer). C Spatial scatter pie chart of estimated cell-type composition within each spot. D Comparing deconvolution methods using ARI and purity. E Expression patterns of the corresponding region-specific marker genes and its imputed expression at three different resolution levels: 160 μm (about 64% of original size), 114 μm (about 32% of original size), 80 μm (about 16% of original size). F Heatmap showing average imputed expression of region-specific marker genes at 80 μm level within each annotated region for SDePER and CARD. G Bar plot showing the ratio of average layer-specific marker gene expression in the corresponding layer among all layers
Fig. 5
Fig. 5
Performance evaluation and comparison using breast cancer dataset. A H&E staining of breast cancer and annotated regions. B Visualization of inferred dominant cell type in each spot (CAF cancer-associated fibroblasts, PVL perivascular-like). C Spatial scatter pie chart of estimated cell-type composition within each spot. D Comparing deconvolution methods using ARI (left) and purity (right). E Expression patterns of the corresponding region-specific marker genes and its imputed expression at three different resolution levels: 160 μm (about 64% of original size), 114 μm (about 32% of original size), 80 μm (about 16% of original size). F Heatmap showing average imputed expression of region-specific marker genes at locations in each annotated region for SDePER and CARD (AT, adipose tissue; Infiltrate, immune infiltrate; Glands, breast glands; Cancer, invasive cancer and cancer in situ). Imputation at 80 μm level was used. A red diagonal indicates that each region-specific marker gene was imputed to have high expression in the region that it is the marker for and low expression in the other regions for which it is not a marker for. G Bar plot showing the ratio of the average imputed expression levels of the region-specific marker gene in the region that it is a maker for to the other regions. Higher ratio corresponds to more different imputed expression levels of the marker genes between its represented region and other regions
Fig. 6
Fig. 6
Performance evaluation and comparison using idiopathic pulmonary fibrosis lung dataset. A H&E staining of breast cancer with annotated regions: respiratory airway (red) and blood vessels (blue). B Heatmaps of selected cell-type marker genes expression patterns for SMC (MYH11), ciliated cells (FOXJ1), AT1 (AQP4), and AT2 (SFTPA1) cells. C The estimated cell-type proportions on each location for SMC, ciliated cells, AT1, and AT2 cells inferred by SDePER, RCTD, SpatialDWLS, and DestVI. D Barplot of the average expression of marker genes among all spots weighted by estimated proportions of the corresponding cell type for each method. E Pairwise correlation of estimated cell-type proportions for each method

Update of

References

    1. Asp M, Bergenstrahle J, Lundeberg J. Spatially resolved transcriptomes-next generation tools for tissue exploration. BioEssays. 2020;42(10):e1900221. - PubMed
    1. Wagner A, Regev A, Yosef N. Revealing the vectors of cellular identity with single-cell genomics. Nat Biotechnol. 2016;34(11):1145–60. - PMC - PubMed
    1. Li YH, et al. Visualization and analysis of gene expression in stanford type A aortic dissection tissue section by spatial transcriptomics. Front Genet. 2021;12:698124. - PMC - PubMed
    1. Stahl PL, et al. Visualization and analysis of gene expression in tissue sections by spatial transcriptomics. Science. 2016;353(6294):78–82. - PubMed
    1. Stickels RR, et al. Highly sensitive spatial transcriptomics at near-cellular resolution with Slide-seqV2. Nat Biotechnol. 2021;39(3):313–9. - PMC - PubMed