In vivo mapping of postprandial hepatic glucose metabolism using dynamic magnetic resonance spectroscopy combined with stable isotope flux analysis in Roux-en-Y gastric bypass adults and non-operated controls: A case-control study
- PMID: 39402788
- PMCID: PMC11618218
- DOI: 10.1111/dom.16001
In vivo mapping of postprandial hepatic glucose metabolism using dynamic magnetic resonance spectroscopy combined with stable isotope flux analysis in Roux-en-Y gastric bypass adults and non-operated controls: A case-control study
Abstract
Aims: Roux-en-Y gastric bypass (RYGB) surgery alters postprandial glucose profiles, causing post-bariatric hypoglycaemia (PBH) in some individuals. Due to the liver's central role in glucose homeostasis, hepatic glucose handling might differ in RYGB-operated patients with PBH compared to non-operated healthy controls (HC).
Materials and methods: We enrolled RYGB-operated adults with PBH and HCs (n = 10 each). Participants ingested 60 g of [6,6'-2H2]-glucose (d-glucose) after an overnight fast. Deuterium metabolic imaging (DMI) with interleaved 13C magnetic resonance spectroscopy was performed before and until 150 min post-d-glucose intake, with frequent blood sampling to quantify glucose enrichment and gluco-regulatory hormones until 180 min. Glucose fluxes were assessed by mathematical modelling. Outcome trajectories were described using generalized additive models.
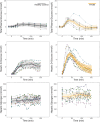
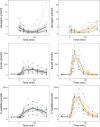
Results: In RYGB subjects, the hepatic d-glucose signal increased early, followed by a decrease, whereas HCs exhibited a gradual increase and consecutive stabilization. Postprandial hepatic glycogen accumulation and the suppression of endogenous glucose production were lower in RYGB patients than in HCs, despite higher insulin exposure, indicating lower hepatic insulin sensitivity. The systemic rate of ingested d-glucose was faster in RYGB, leading to a higher, earlier plasma glucose peak and increased insulin secretion. Postprandial glucose disposal increased in RYGB patients, without between-group differences in peripheral insulin sensitivity.
Conclusions: Exploiting DMI with stable isotope flux analysis, we observed distinct postprandial hepatic glucose trajectories and parameters of glucose-insulin homeostasis in RYGB patients with PBH versus HCs. Despite altered postprandial glucose kinetics and higher insulin exposure, there was no evidence of impaired hepatic glucose uptake or output predisposing to PBH in RYGB patients.
Keywords: Roux‐en‐Y gastric bypass; glucose production; glycogen synthesis; liver metabolism; magnetic resonance spectroscopy; metabolic imaging.
© 2024 The Author(s). Diabetes, Obesity and Metabolism published by John Wiley & Sons Ltd.
Conflict of interest statement
The authors declare no conflicts of interest.
Figures


References
MeSH terms
Substances
Grants and funding
LinkOut - more resources
Full Text Sources
Medical
Research Materials

