Importance of the Hemoglobin Glycation Index for Risk of Cardiovascular and Microvascular Complications and Mortality in Individuals with Type 2 Diabetes
- PMID: 39402854
- PMCID: PMC11525700
- DOI: 10.3803/EnM.2024.2001
Importance of the Hemoglobin Glycation Index for Risk of Cardiovascular and Microvascular Complications and Mortality in Individuals with Type 2 Diabetes
Abstract
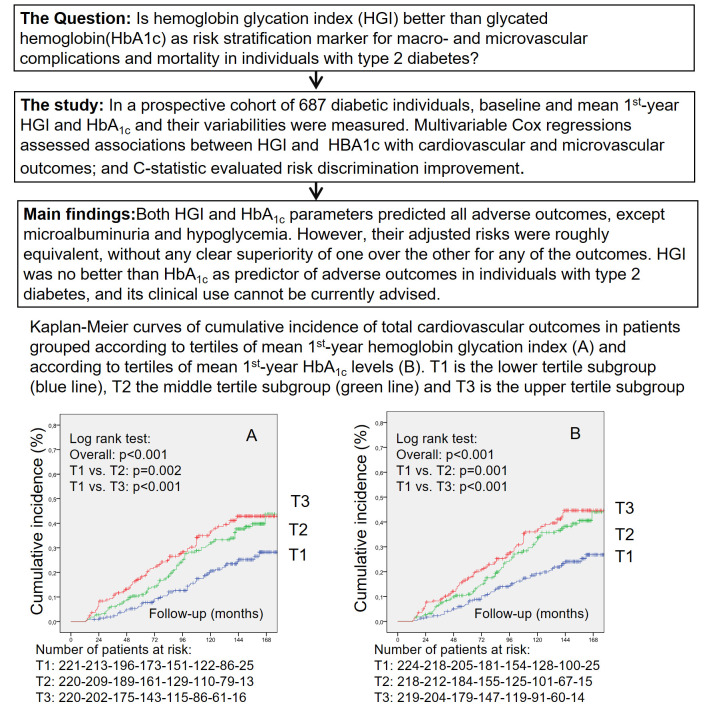
Backgruound: This study investigated the prognostic importance of the hemoglobin glycation index (HGI) for macrovascular and microvascular outcomes, mortality, and hypoglycemia occurrence in a type 2 diabetes cohort and compared it to glycated hemoglobin (HbA1c).
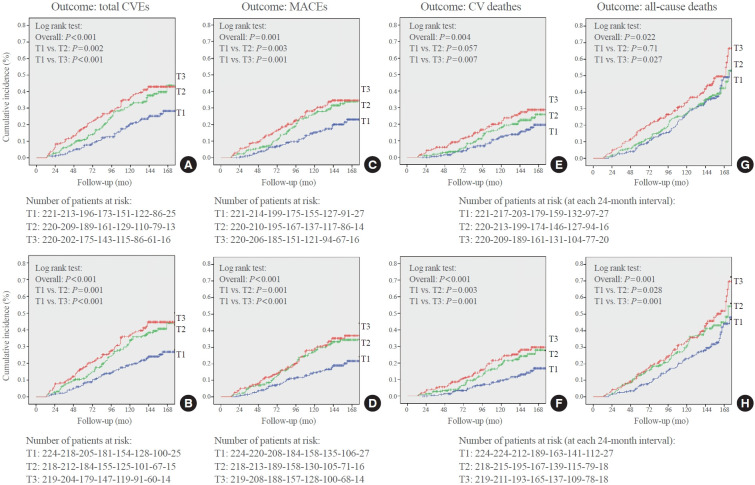
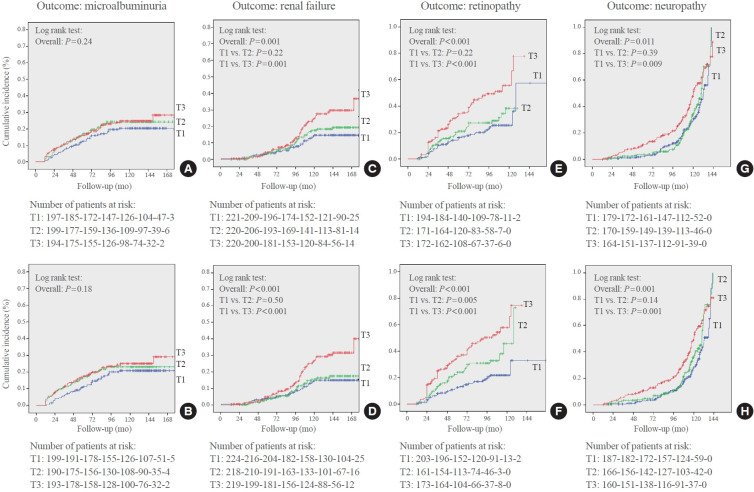
Methods: Baseline and mean first-year HGI and HbA1c, and the variability thereof, were assessed in 687 individuals with type 2 diabetes (median follow-up, 10.6 years). Multivariable Cox regression was conducted to evaluate the associations of HGI and HbA1c parameters with macrovascular (total and major cardiovascular events) and microvascular outcomes (microalbuminuria, advanced renal failure, retinopathy, and peripheral neuropathy), mortality (all-cause and cardiovascular), and moderate/severe hypoglycemia occurrence.
Results: During follow-up, there were 215 total cardiovascular events (176 major) and 269 all-cause deaths (131 cardiovascular). Microalbuminuria developed in 126 patients, renal failure in 104, retinopathy in 161, and neuropathy in 177. There were 90 hypoglycemia episodes. Both HGI and HbA1c predicted all adverse outcomes, except microalbuminuria and hypoglycemia. Their adjusted risks were roughly equivalent for all outcomes. For example, the adjusted hazard ratios (HRs) with 95% confidence intervals (CIs), estimated for 1 standard deviation increments, of mean first-year HGI were 1.23 (1.05 to 1.44), 1.20 (1.03 to 1.38), 1.36 (1.11 to 1.67), 1.28 (1.09 to 1.67), and 1.29 (1.09 to 1.54), respectively, for cardiovascular events, all-cause mortality, renal failure, retinopathy, and neuropathy; whereas the respective HRs (95% CIs) of mean HbA1c were 1.31 (1.12 to 1.53), 1.28 (1.11 to 1.48), 1.36 (1.11 to 1.67), 1.33 (1.14 to 1.55), and 1.29 (1.09 to 1.53).
Conclusion: HGI was no better than HbA1c as a predictor of adverse outcomes in individuals with type 2 diabetes, and its clinical use cannot be currently advised.
Keywords: Cardiovascular events; Cohort studies; Diabetes mellitus, type 2; Hemoglobin glycation index; Microvascular complications; Mortality.
Conflict of interest statement
No potential conflict of interest relevant to this article was reported.
Figures
Comment in
-
Importance of the Hemoglobin Glycation Index for Risk of Cardiovascular and Microvascular Complications and Mortality in Individuals with Type 2 Diabetes (Endocrinol Metab 2024;39:732-47, Claudia Regina Lopes Cardoso et al.).Endocrinol Metab (Seoul). 2024 Dec;39(6):970-972. doi: 10.3803/EnM.2024.2231. Epub 2024 Dec 23. Endocrinol Metab (Seoul). 2024. PMID: 39736822 Free PMC article. No abstract available.
-
Importance of the Hemoglobin Glycation Index for Risk of Cardiovascular and Microvascular Complications and Mortality in Individuals with Type 2 Diabetes (Endocrinol Metab 2024;39:732-47, Claudia Regina Lopes Cardoso et al.).Endocrinol Metab (Seoul). 2024 Dec;39(6):973-974. doi: 10.3803/EnM.2024.603. Epub 2024 Dec 23. Endocrinol Metab (Seoul). 2024. PMID: 39736823 Free PMC article. No abstract available.
References
-
- Hempe JM, Gomez R, McCarter RJ, Jr, Chalew SA. High and low hemoglobin glycation phenotypes in type 1 diabetes: a challenge for interpretation of glycemic control. J Diabetes Complications. 2002;16:313–20. - PubMed
-
- Kilpatrick ES, Rigby AS, Atkin SL. Variability in the relationship between mean plasma glucose and HbA1c: implications for the assessment of glycemic control. Clin Chem. 2007;53:897–901. - PubMed
MeSH terms
Substances
Grants and funding
LinkOut - more resources
Full Text Sources
Medical