. 2024 Dec 6;33(24):2111-2122.
doi: 10.1093/hmg/ddae143.

Ceramide lowering rescues respiratory defects in a Drosophila model of acid sphingomyelinase deficiency

Affiliations

Ceramide lowering rescues respiratory defects in a Drosophila model of acid sphingomyelinase deficiency

Alexander J Hull et al. Hum Mol Genet. .

Abstract

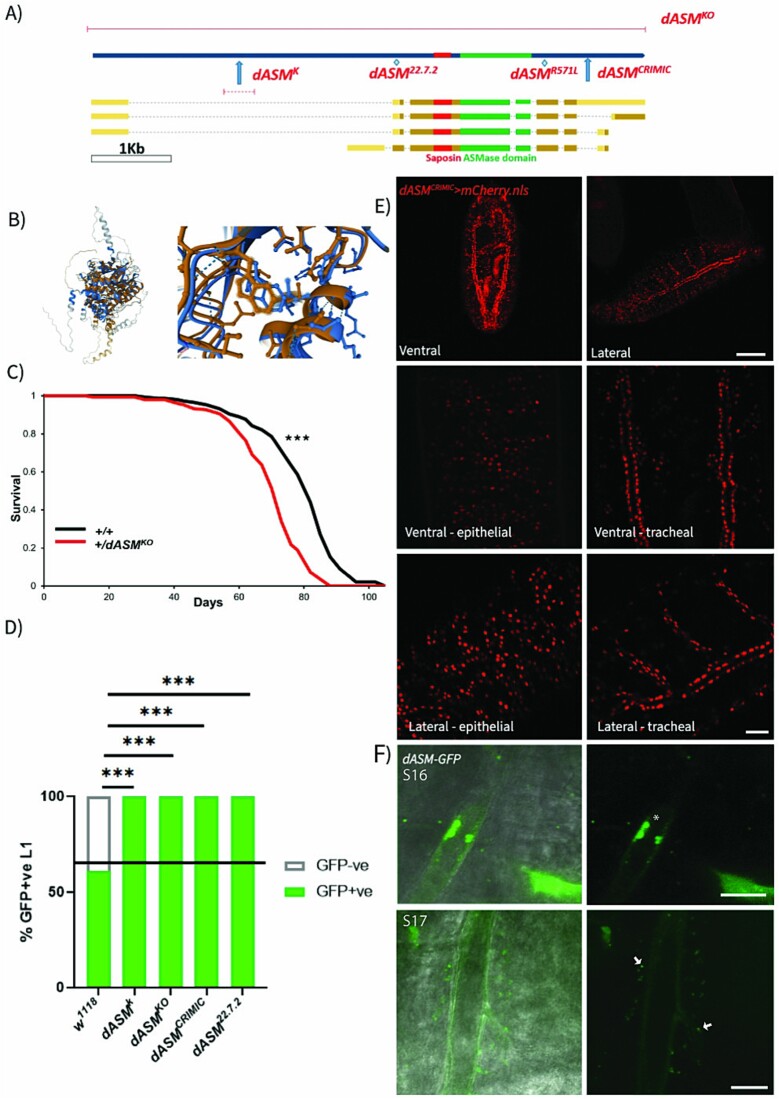
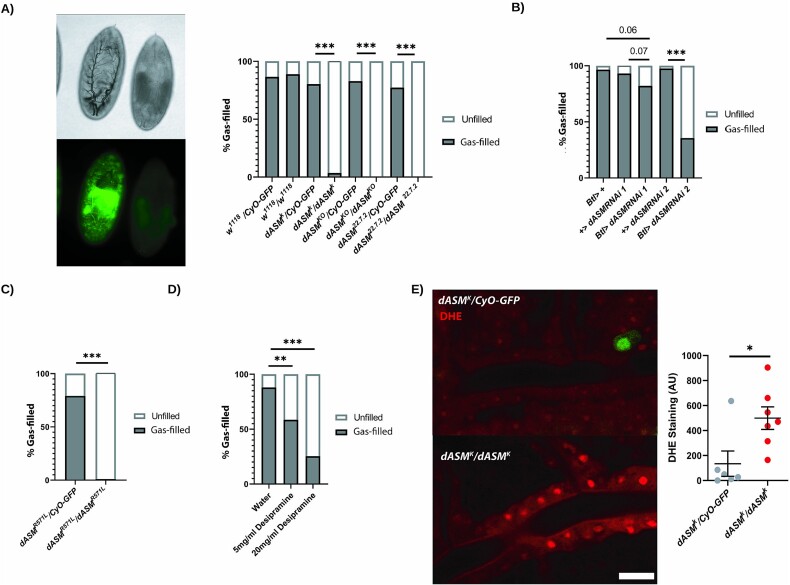
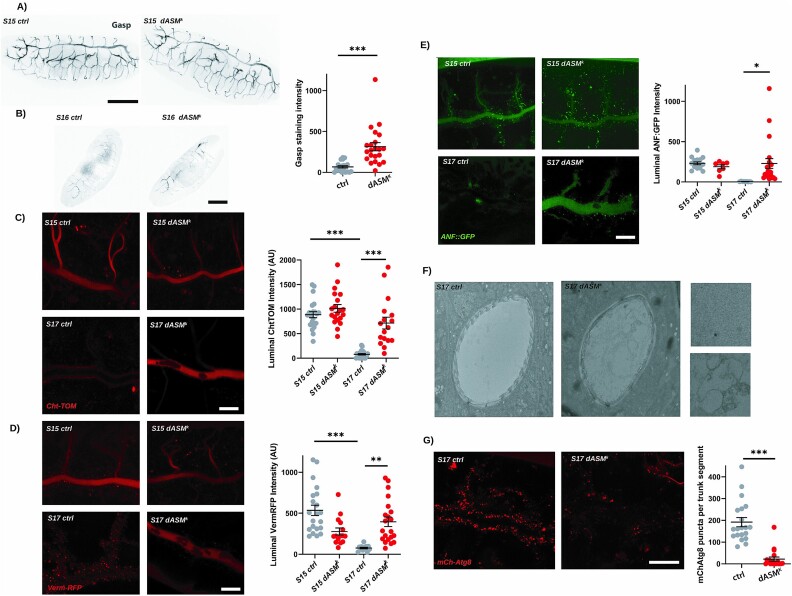
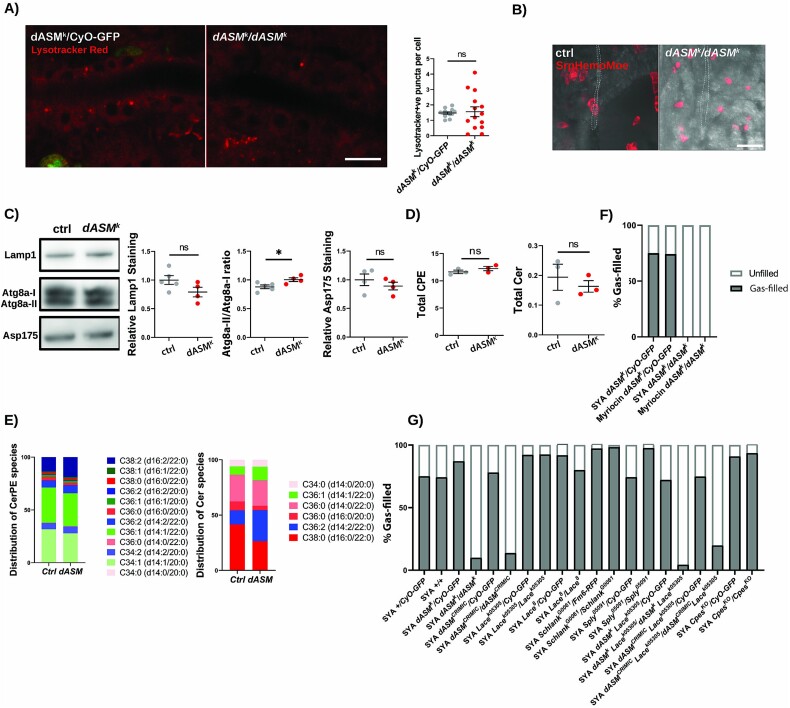
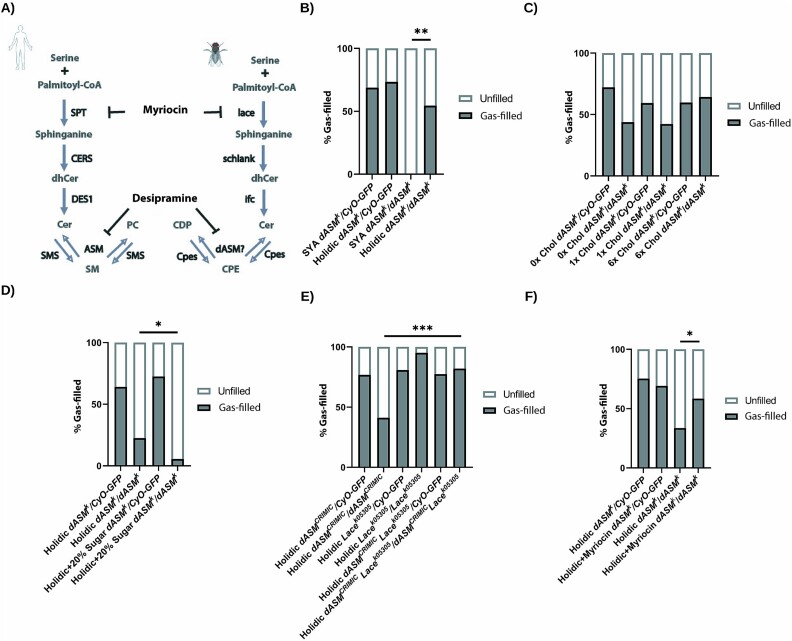
Types A and B Niemann-Pick disease (NPD) are inherited multisystem lysosomal storage disorders due to mutations in the SMPD1 gene. Respiratory dysfunction is a key hallmark of NPD, yet the mechanism for this is underexplored. SMPD1 encodes acid sphingomyelinase (ASM), which hydrolyses sphingomyelin to ceramide and phosphocholine. Here, we present a Drosophila model of ASM loss-of-function, lacking the fly orthologue of SMPD1, dASM, modelling several aspects of the respiratory pathology of NPD. dASM is expressed in the late-embryonic fly respiratory network, the trachea, and is secreted into the tracheal lumen. Loss of dASM results in embryonic lethality, and the tracheal lumen fails to fill normally with gas prior to eclosion. We demonstrate that the endocytic clearance of luminal constituents prior to gas-filling is defective in dASM mutants, and is coincident with autophagic, but not lysosomal defects, in late stage embryonic trachea. Finally, we show that although bulk sphingolipids are unchanged, dietary loss of lipids in combination with genetic and pharmacological block of ceramide synthesis rescues the airway gas-filling defects. We highlight myriocin as a potential therapeutic drug for the treatment of the developmental respiratory defects associated with ASM deficiency, and present a new NPD model amenable to genetic and pharmacological screens.

Keywords: Drosophila; SMPD1; dASM; Niemann-Pick; lysosomal storage disorder; lysosome; sphingolipid.


Figures

Figure 1
Figure 1
Drosophila dASM is required for developmental viability. (A) Annotated schematic of the CG3376/dASM coding region and the sites of available mutants. (B) Alphafold prediction of human ASM (blue) and Drosophila dASM (orange) secondary structures, full view (left), and a close-up of the ASMase active site (right). (C) Survival curves of dASMKO heterozygote and control flies (n = 150, log rank tests, P < 0.0001). (D) Schematic of crossing scheme and quantification of GFP +ve heterozygous to GFP −ve homozygous 1st instar larvae (n = 272, 293, 151, 403, 113. w1118 vs dASMk/KO/CRIMIC/22.7.2, P < 0.0001***, χ2 test). (E) Dorsal and ventral views of the localisation of dASM expression in the trachea and epidermis of stage 17 embryos using dASMCRIMIC > mCherry.nls. Scale bar = 100 μm for whole embryos, and 25 μm for 63× magnification images. (F) Localisation of dASM-GFP within the tracheal lumen at stage 16 (asterisk) and in vesicles within the tracheal epithelia (arrows) and on the luminal edge at stage 17, scale bar = 10 μm.
Figure 2
Figure 2
dASM mutants display tracheal gas-filling defects. (A). Example brightfield image of stage 17 heterozygous (GFP +ve) and homozygous (GFP −ve) dASMk embryos, demonstrating a loss of tracheal gas-filling. Quantification of airway gas-filling in dASM mutants and controls (n = 18, 52, 57, 173, 101, 204, 31, 44, w1118 vs dASMk/KO/CRIMIC/22.7.2, P < 0.0001, χ2 test). (B) Quantification of gas-filling defects following tracheal specific expression (Btl-GAL4) of RNAi against dASM (n = 29, 58, 56, 78, 76, dASM RNAi 1 vs Btl > dASM RNAi 1 P = 0.07, dASM RNAi 2 vs Btl > dASM RNAi 2 P < 0.0001, χ2 test). (C) Gas-filling defects in dASMR571L embryos containing a point mutation in the ASMase domain (n = 220, 95, P < 0.0001, χ2 test). (D) Quantification of gas-filling defects in stage 17 embryos injected with either desipramine (des) or water 30 min after egg-laying (n = 50, 41, 67, PBS vs 5 mg/ml des P = 0.0013, PBS vs 20 mg/ml des P < 0.0001, χ2 test). (E) Example image and quantification of DHE staining in late stage 17 dASMk mutant and control (dASMk/CyO-GFP) tracheal lumens showing a significant increase in ROS (P = 0.0207, t-test), scale bar = 10 μm.
Figure 3
Figure 3
dASM mutants exhibit defects in the clearance of chitin from the tracheal lumen during development. (A) Images of whole tracheal morphology of stage 15 control (ctrl) and dASMk flies stained for Gasp, highlighting that all elements of the tracheal network are intact, scale bar = 100 μm. (B) Example confocal images of early stage 16 ctrl or dASMk embryos stained for Gasp and quantification of luminal staining intensity (P = 0.0003, t-test), scale bar = 100 μm. (C) Example confocal images of ctrl and dASMk embryos at stage 15 and 17 expressing Btl > ChtTOM and quantification of staining intensity across the tracheal lumen (S15 ctrl vs S17 ctrl P < 0.0001, S17 ctrl vs S17 dASMk P < 0.0001, one-way ANOVA with Tukey’s multiple comparisons test), scale bar = 25 μm. (D) Example confocal images of ctrl and dASMk embryos at stage 15 and late stage 17 expressing Btl > VermRFP and quantification of staining intensity across the tracheal lumen (S15 ctrl vs S17 ctrl P < 0.0001, S17 ctrl vs S17 dASMk P = 0.0015, one-way ANOVA with Tukey’s multiple comparisons test), scale bar = 25 μm. (E) Example confocal images of ctrl and dASMk embryos at stage 15 and 17 expressing Btl > ANF::GFP and quantification of staining intensity across the tracheal lumen (S15 ctrl vs S17 ctrl P = 0.0233, S17 ctrl vs S17 dASMk P = 0.0176, one-way ANOVA with Tukey’s multiple comparisons test), scale bar = 25 μm. (F) Transverse TEM section of the dorsal trunk in ctrl and dASMk stage 17 embryos. (G) Example confocal images of stage 17 ctrl and dASMk embryos expressing Btl > mCh-Atg8 and quantification of staining intensity (P < 0.0001, t-test), scale bar = 25 μm.
Figure 4
Figure 4
dASM mutants fail to demonstrate macrophage ingression, lysosomal expansion or changes in bulk sphingolipid abundance. (A) Example images showing Lysotracker red DND99 staining within stage 17 ctrl and dASMk tracheal cells and quantification (P = 0.8113, t-test), scale bar = 10 μm. (B) Representative images of macrophages (Srp.Hemo.Moe.mCherry) and trachea (Brightfield) showing no colocalisation or infiltration of macrophages in ctrl or dASMk mutants, scale bar = 25 μm. (C) Western blots on whole stage 17 ctrl or dASMk embryo extracts. Example images and quantification normalised to actin for Lamp1 (P = 0.1094. t-test), Atg8a-II/I ratio (P = 0.003, t-test) and Asp175 (P = 0.4025, t-test), demonstrating no change in embryo-wide lysosomal or apoptotic activity. (D) Graphs of overall abundance of ceramide (Cer) and Cer phosphoethanolamine (CPE) in ctrl or dASMk mutant stage 17 embryos (ctrl vs dASMk CPE P = 0.2943, ctrl vs dASMk Cer P = 0.5532, t-test) as detected by HPLC. (E) Graph of sphingolipid species by chain length and saturation state in ctrl or dASMk mutant stage 17 embryos. (F) Quantification of gas-filling defects in dASM flies with myriocin or DMSO supplementation in the maternal diet. (G) Quantification of gas-filling in mutants of sphingolipid biosynthesis alone or in combination with the dASMk mutant, all raised on a standard diet of sugar-yeast-agar (SYA).
Figure 5
Figure 5
Dietary lipid restriction alongside genetic and pharmacological restriction of Cer synthesis alleviates dASM tracheal gas-filling defects. (A) Diagram of sphingolipid synthesis pathways in mammals and Drosophila. (B) Quantification of gas-filling defects in ctrl or dASMk stage 17 embryos from maternal flies raised on SYA medium or a holidic diet (n = 45, 83, 16, 33, SYA dASMk vs holidic dASMk P = 0.0002, χ2 test). (C) Quantification of gas-filling defects in ctrl or dASMk stage 17 embryos from maternal flies raised on a holidic diet with 0×, 1× or 6× dietary cholesterol, showing no significant effect of cholesterol supplementation (n = 43, 64, 67, 16, 26, 28, 0× Chol dASMk vs 1× Chol dASMk P = 0.9269, 1× Chol dASMk vs 6× Chol dASMk P = 0.1056, χ2 test). (D) Quantification of gas-filling defects in ctrl or dASMk stage 17 embryos from maternal flies raised on a holidic diet with 0 or 20% sugar (n = 106, 53, 91, 36, P = 0.0298, χ2 test). (E) Quantification of gas-filling defects in ctrl and dASMk stage 17 embryos from maternal flies combining LaceK05305 raised on a holidic diet (n = 99, 34, 120, 41, 195, 78, dASMCRIMIC vs dASMCRIMIC LaceK05305 P < 0.0001, χ2 test). (F) Quantification of gas-filling defects in ctrl or dASMk stage 17 embryos from maternal flies raised on a holidic diet with or without myriocin supplementation (n = 199, 156, 86, 77, dASMk ctrl vs dASMk myriocin P = 0.0016, χ2 test).

References

    1. Zampieri S, Filocamo M, Pianta A. et al. SMPD1 mutation update: database and comprehensive analysis of published and novel variants. Hum Mutat 2016;37:139–147. - PubMed
    1. Stenson PD, Ball EV, Mort M. et al. Human gene mutation database (HGMD): 2003 update. Hum Mutat 2003;21:577–581. - PubMed
    1. McGovern MM, Avetisyan R, Sanson BJ. et al. Disease manifestations and burden of illness in patients with acid sphingomyelinase deficiency (ASMD). Orphanet J Rare Dis 2017;12:41. - PMC - PubMed
    1. Gan-Or Z, Ozelius LJ, Bar-Shira A. et al. The p.L302P mutation in the lysosomal enzyme gene SMPD1 is a risk factor for Parkinson disease. Neurology 2013;80:1606–1610. - PMC - PubMed
    1. Gan-Or Z, Orr-Urtreger A, Alcalay RN. et al. The emerging role of SMPD1 mutations in Parkinson's disease: implications for future studies. Parkinsonism Relat Disord 2015;21:1294–1295. - PubMed

MeSH terms

LinkOut - more resources