. 2024 Sep 20;27(10):111008.
doi: 10.1016/j.isci.2024.111008. eCollection 2024 Oct 18.

Photoswitchable TRPC6 channel activators evoke distinct channel kinetics reflecting different gating behaviors

Affiliations

Photoswitchable TRPC6 channel activators evoke distinct channel kinetics reflecting different gating behaviors

Maximilian Keck et al. iScience. .

Abstract

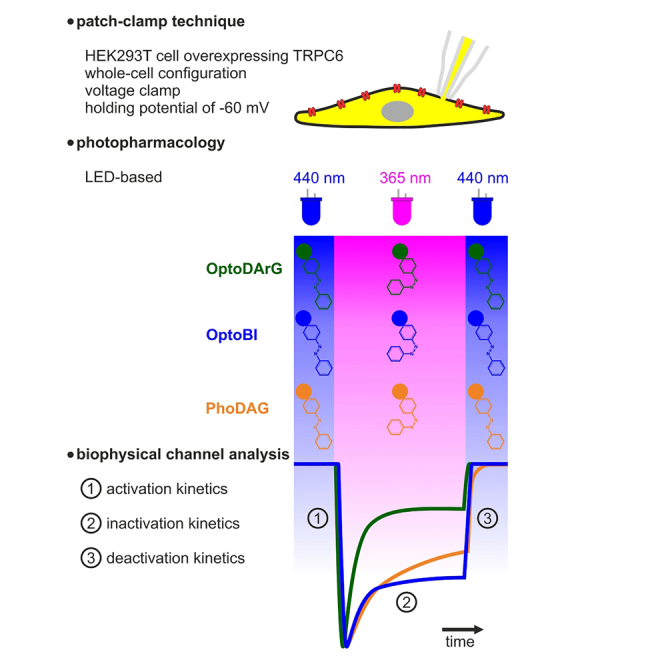
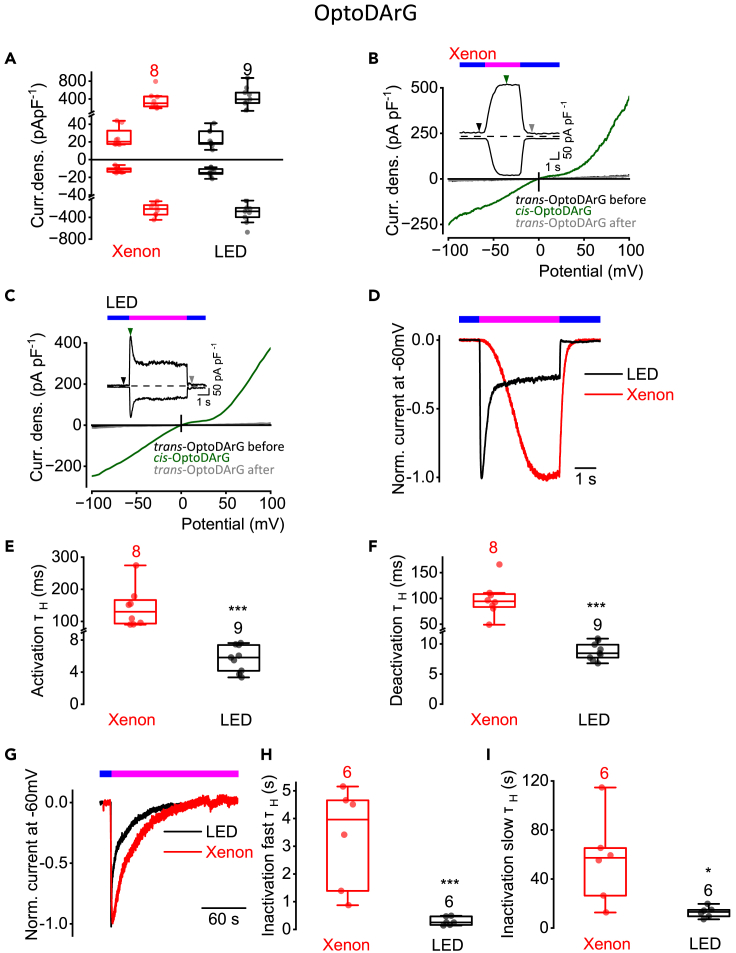
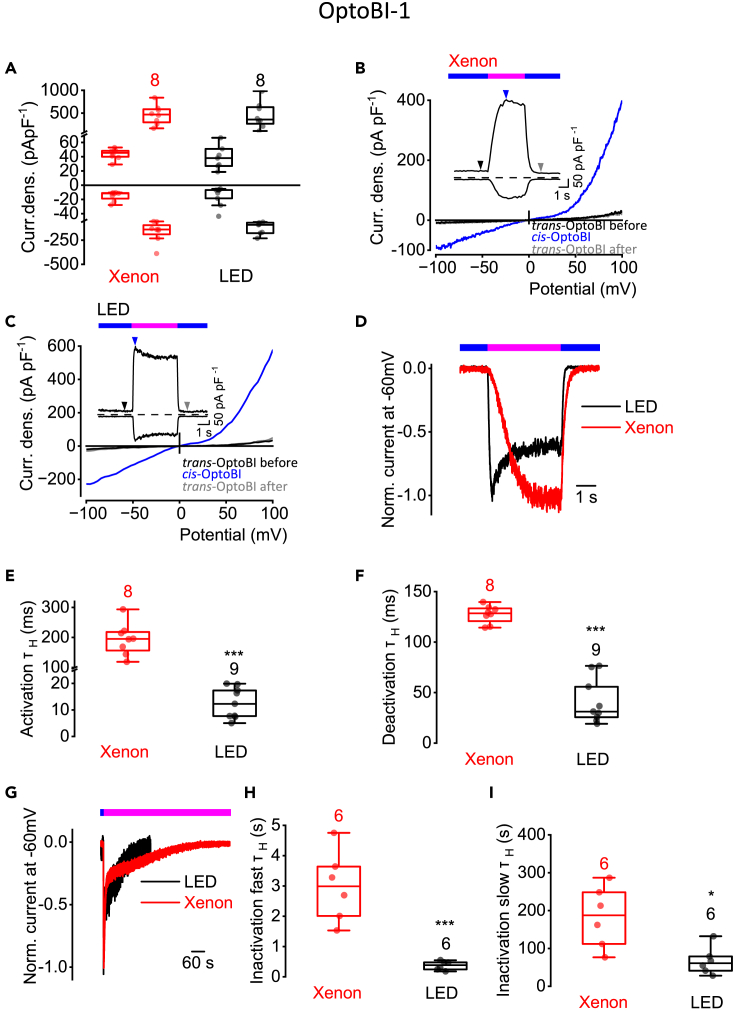
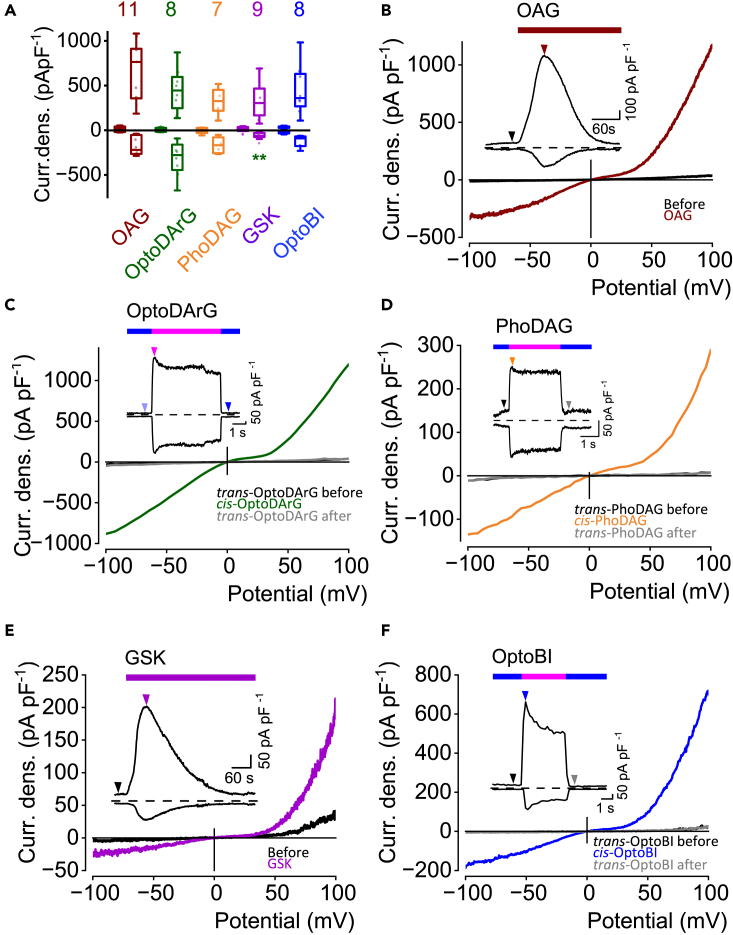
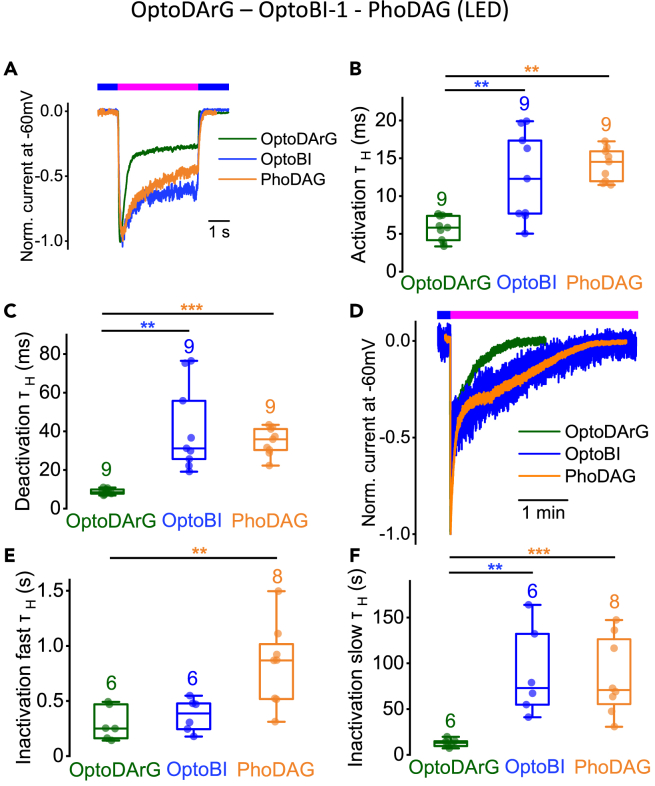
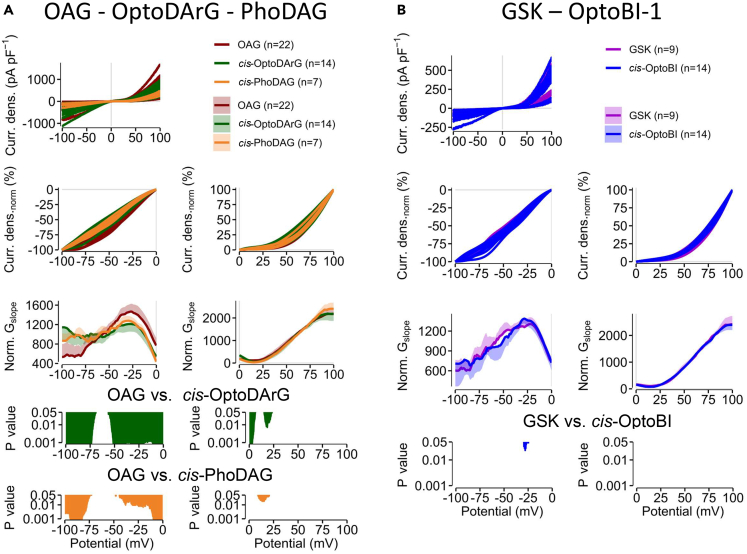
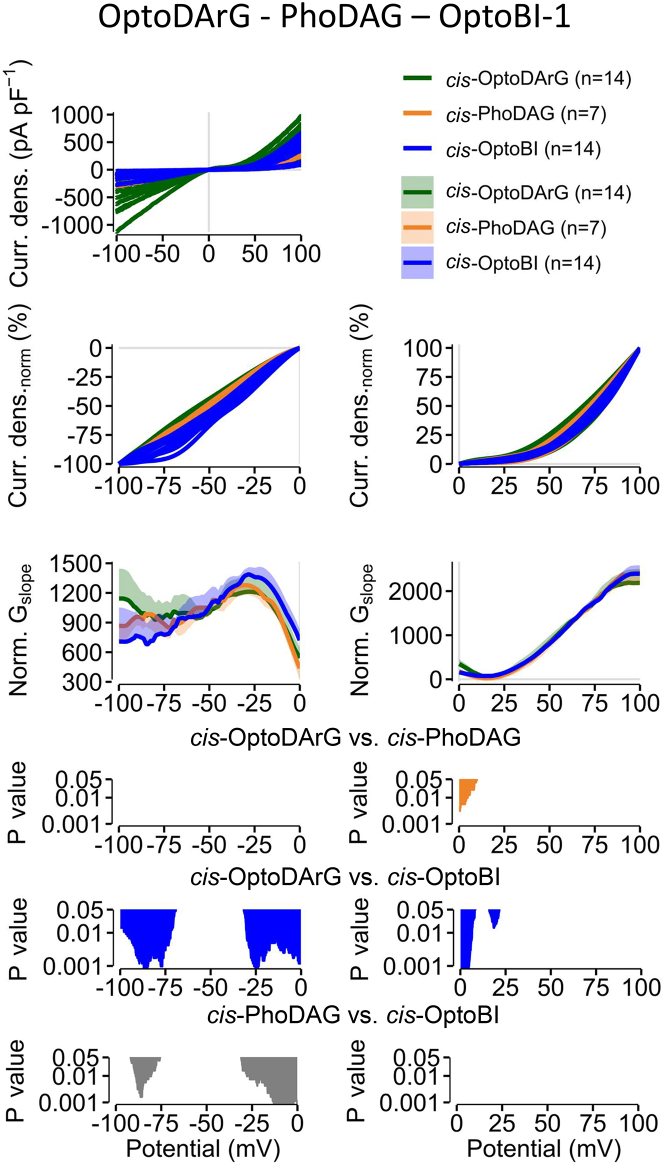
The non-selective transient receptor potential canonical 6 (TRPC6) cation channels have several physiological and pathophysiological effects. They are activated by the lipid second messenger diacylglycerol (DAG) and by non-lipidic compounds such as GSK 1702934A (GSK). Advances in photopharmacology led to the development of photoswitchable activators such as PhoDAG, OptoDArG, and OptoBI-1 that can be switched ON and OFF with the spatiotemporal precision of light. We aimed to elucidate whether these photopharmaceuticals allow for a reliable determination of the ion channel current kinetics. We performed electrophysiological whole-cell measurements in the overexpression system and analyzed TRPC6 currents induced by photoswitching. We observed distinct activation, deactivation and inactivation current kinetics suggesting that each photoswitchable activator elicits a distinct active channel state. Notably, the current kinetics strongly depended on the intensity of the light source. Altogether, photopharmaceuticals are advantageous for an extended biophysical characterization of whole-cell currents and provide insight into their gating mechanism.

Keywords: Biological sciences; Biophysical chemistry; Biophysics.


Conflict of interest statement

The authors declare no competing interests.

Figures

None
Graphical abstract
Figure 1
Figure 1
OptoDArG-evoked TRPC6 current kinetics strongly depend on the intensity of the light source Electrophysiological whole-cell measurements of TRPC6 overexpressing HEK293T cells in the presence of 30 μM OptoDArG. (A) Summaries of current densities (“Curr. dens.”) at potentials of ±100 mV evoked by light using a xenon lamp (red) or a LED (black). First small boxplots represent current densities in the presence of blue light (445 nm) which establishes trans-OptoDArG and second boxplots represent maximal current densities in the presence of UV light (365 nm) which establishes cis-OptoDArG. No significant differences between trans or cis-OptoDArG-induced current densities were observed using xenon or LED light source, respectively (Mann-Whitney U test). (B and C) Representative current density (“Curr. dens.”)-time courses ±100 mV and current density-voltage relations using xenon lamp (B) or LED (C) for photoswitching. The arrows indicate the time point at which the trans- and the maximal cis-OptoDArG-induced current density-voltage relations were selected. Bars over current density-time courses indicate the application of light of the wavelength 445 nm (blue) and of 365 nm (magenta). (D) Representative normalized time courses of TRPC6 inward currents at constant holding potential of −60 mV during photoswitching from blue light (blue bar) to UV light (magenta bar) and back to blue light (blue bar) using a xenon lamp (red) or LED (black). (E and F) Summaries of half-life time constants (τH) of the activation (E) and deactivation (F) kinetics (∗∗∗p < 0.001; Mann-Whitney U test). (G) Representative normalized time courses of TRPC6 inward currents at constant holding potential of −60 mV induced by photoswitching from blue light to UV light using xenon lamp (red) or LED (black). The duration of light application (blue and magenta bar) is indicated. (H and I) Summaries of half-life time constants (τH) of the fast (H) and slow (I) inactivation kinetics. (∗p < 0.05, ∗∗∗p < 0.001; Mann-Whitney U test). (E, F, H, and I) Data are displayed as boxplots and interquartile ranges. Numbers over boxplots indicate number of measured cells.
Figure 2
Figure 2
OptoBI-1-induced TRPC6 current kinetics strongly rely on the intensity of the light source Electrophysiological whole-cell measurements of TRPC6 overexpressing HEK293T cells in the presence of 10 μM OptoBI-1. (A) Summaries of current densities (“Curr. dens.”) at potentials of ±100 mV evoked by application of UV light using a xenon lamp (red) or a LED (black). First small boxplots represent current densities induced by trans- and second boxplots maximal current densities induced by cis-OptoBI-1. No significant differences between trans- or cis-OptoBI-1-induced current densities using xenon lamp or LED (Mann-Whitney U test). (B and C) Representative current density (“Curr. dens.”)-time courses ±100 mV and current density-voltage relations using xenon lamp (B) or LED (C) for photoswitching. The arrows indicate the time point at which the trans- and the maximal cis-OptoBI-1-induced current density-voltage relations were selected. Bars over current density-time courses indicate the application of light of the wavelength 445 nm (blue) and of 365 nm (magenta). (D) Representative normalized time courses of TRPC6 currents at constant holding potential of −60 mV during photoswitching from blue light (blue bar) to UV light (magenta bar) and back to blue light (blue bar) using a xenon lamp (red) or LED (black). (E and F) Summaries of half-life time constants (τH) of the activation (E) and deactivation (F) kinetics (∗∗∗p < 0.001; Mann-Whitney U test). (G) Representative normalized time courses of TRPC6 currents at constant holding potential of −60 mV induced by photoswitching from blue light to UV light using xenon lamp (red) or LED (black). The duration of light application (blue and magenta bar) is indicated. (H and I) Summaries of half-life time constants (τH) of the fast (H) and slow (I) inactivation kinetics (∗p < 0.05, ∗∗∗p < 0.001; Mann-Whitney U test). (E, F, H, and I) Data are displayed as boxplots and interquartile ranges. Numbers over boxplots indicate number of measured cells.
Figure 3
Figure 3
TRPC6 current densities elicited by photoswitchable and non-photoswitchable TRPC6 channel activators Electrophysiological whole-cell measurements of TRPC6 overexpressing HEK293T cells. (A) Summaries of current densities (“Curr. dens.”) at potentials of ±100 mV evoked by application 100 μM OAG, of 10 μM GSK 1702934A (“GSK”), of blue light and UV light using LEDs in the presence of OptoDArG, PhoDAG or OptoBI-1. First small boxplots represent current densities before application of OAG or GSK or induced by trans-OptoDArG, trans-PhoDAG or trans-OptoBI-1 and second boxplots maximal current densities induced by OAG, cis-OptoDArG, cis-PhoDAG, GSK or cis-OptoBI-1. Significant differences were calculated using Kruskal-Wallis test. Brown asterisks indicates significant differences compared to the OAG-induced current densities and green asterisks compared to OptoDArG-induced current densities (∗∗p < 0.01, ∗p < 0.05). Data are displayed as boxplots and interquartile ranges. Numbers over boxplots indicate number of measured cells. (B–F) Representative current density (“Curr. dens.”)-time courses at ±100 mV and current density-voltage relations. Bars indicate bath application of OAG (B, brown bar) or GSK (E, violet bar) or of blue light (C, D, F; blue bar) or UV light (C, D, F; magenta bar) using LEDs. The arrows indicate the time point at which the current density-voltage relations were selected.
Figure 4
Figure 4
Photoswitching of OptoDArG, PhoDAG, and OptoBI-1 with LEDs results in distinct TRPC6 current kinetics Electrophysiological whole-cell measurements of TRPC6 overexpressing HEK293T cells. (A) Representative normalized time courses of TRPC6 currents at constant holding potential of −60 mV during photoswitching from blue light (blue bar) to UV light (magenta bar) and back to blue light (blue bar) using LEDs. (B and C) Summaries of half-life time constants (τH) of the activation (B) and deactivation (C) kinetics (∗p < 0.05, ∗∗p < 0.01, Kruskal-Wallis test). (D) Representative normalized time courses of TRPC6 currents at constant holding potential of −60 mV induced by photoswitching from blue light to UV light using LEDs. The duration of light application (blue and magenta bar) is indicated. (E and F) Summaries of half-life time constants (τH) of the fast (E) and slow (F) inactivation kinetics (∗p < 0.05, ∗∗p < 0.01; Kruskal-Wallis test). (B, C, E, and F) Data are displayed as boxplots and interquartile ranges. Numbers over boxplots indicate number of measured cells.
Figure 5
Figure 5
Calculation of the normalized slope conductance reveals differences between photoswitchable and non-photoswitchable TRPC6 activators Whole-cell measurements of TRPC6 overexpressing HEK293T cells. (A) All maximal current density-voltage relations (“Curr. dens.”) induced by OAG, cis-OptoDArG or cis-PhoDAG are displayed (previously). The current density-voltage relations were smoothed and normalized (“Curr. densnorm [%]”). The calculated normalized slope conductance (NSC) (“Norm. Gslope”) is displayed as mean ± SD. p values are calculated using Kruskal-Wallis test. (B) All maximal current densities (“Curr. dens.”) at potentials of ±100 mV induced by GSK or cis-OptoBI-1 are displayed (previously). The current density-voltage relations were smoothed and normalized (“Curr. densnorm [%]”). The calculated NSC (“Norm. Gslope”) is displayed as mean ± SD. p values are calculated using Mann-Whitney U test.
Figure 6
Figure 6
Comparison of photoswitchable TRPC6 activators shows significant differences in the NSC progression Whole-cell measurements of TRPC6 overexpressing HEK293T cells. All maximal current density-voltage relations (“Curr. dens.”) induced cis-OptoDArG, cis-PhoDAG or cis-OptoBI-1 are displayed (previously). The current density-voltage relations were smoothed and normalized (“Curr. densnorm (%)”). The calculated NSC (“Norm. Gslope”) is displayed as mean ± SD. p values are calculated using Kruskal-Wallis test.

References

    1. Hofmann T., Obukhov A.G., Schaefer M., Harteneck C., Gudermann T., Schultz G. Direct activation of human TRPC6 and TRPC3 channels by diacylglycerol. Nature. 1999;397:259–263. doi: 10.1038/16711. - DOI - PubMed
    1. Mederos y Schnitzler M., Gudermann T., Storch U. Emerging Roles of Diacylglycerol-Sensitive TRPC4/5 Channels. Cells. 2018;7 doi: 10.3390/cells7110218. - DOI - PMC - PubMed
    1. Storch U., Forst A.L., Pardatscher F., Erdogmus S., Philipp M., Gregoritza M., Mederos y Schnitzler M., Gudermann T. Dynamic NHERF interaction with TRPC4/5 proteins is required for channel gating by diacylglycerol. Proc. Natl. Acad. Sci. USA. 2017;114:E37–E46. doi: 10.1073/pnas.1612263114. - DOI - PMC - PubMed
    1. Lucas P., Ukhanov K., Leinders-Zufall T., Zufall F. A diacylglycerol-gated cation channel in vomeronasal neuron dendrites is impaired in TRPC2 mutant mice: mechanism of pheromone transduction. Neuron. 2003;40:551–561. doi: 10.1016/s0896-6273(03)00675-5. - DOI - PubMed
    1. Ningoo M., Plant L.D., Greka A., Logothetis D.E. PIP2 regulation of TRPC5 channel activation and desensitization. J. Biol. Chem. 2021;296 doi: 10.1016/j.jbc.2021.100726. - DOI - PMC - PubMed

LinkOut - more resources