

RNA-Seq based selection signature analysis for identifying genomic footprints associated with the fat-tail phenotype in sheep
- PMID: 39403211
- PMCID: PMC11471730
- DOI: 10.3389/fvets.2024.1415027
RNA-Seq based selection signature analysis for identifying genomic footprints associated with the fat-tail phenotype in sheep
Abstract
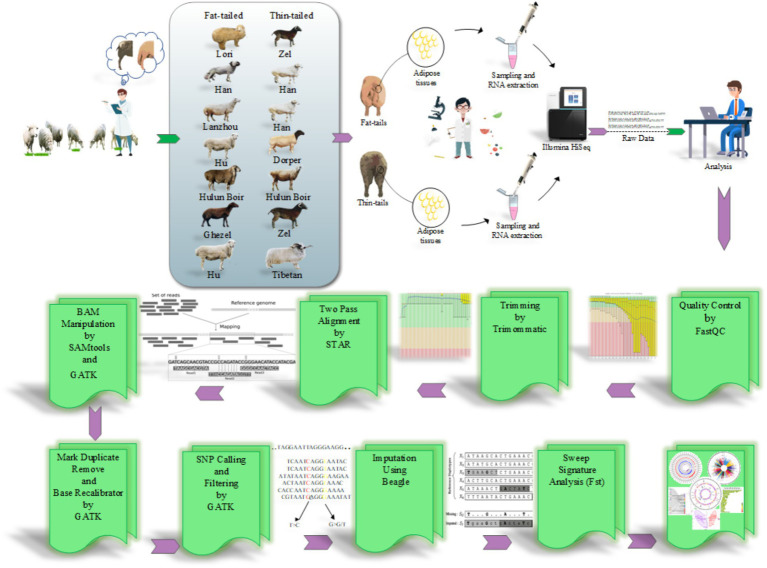
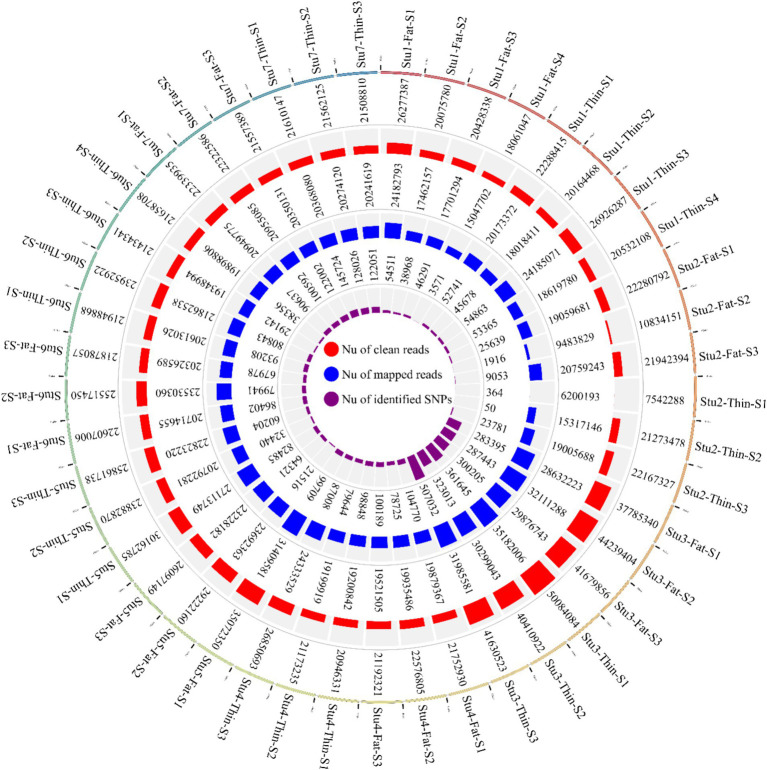
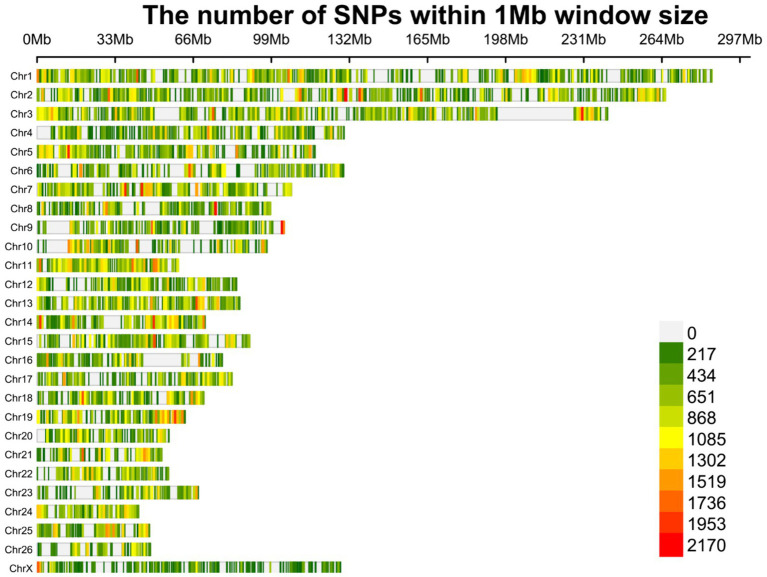
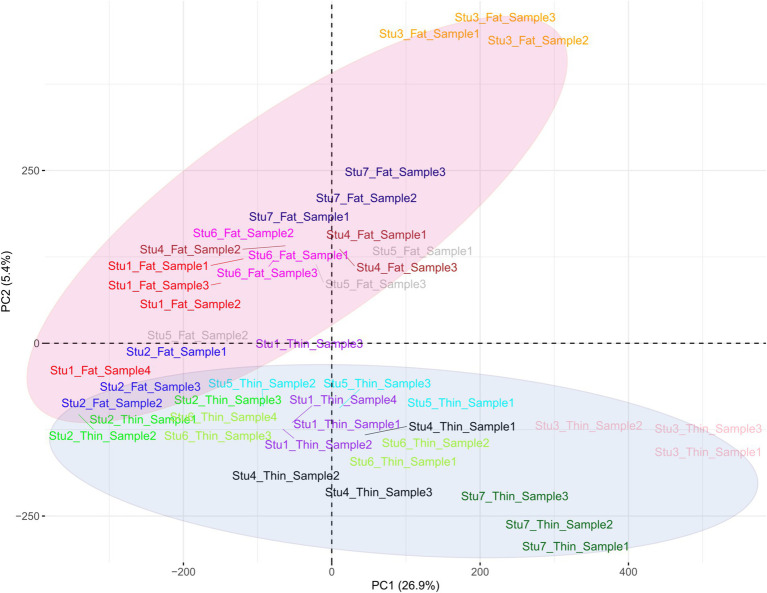
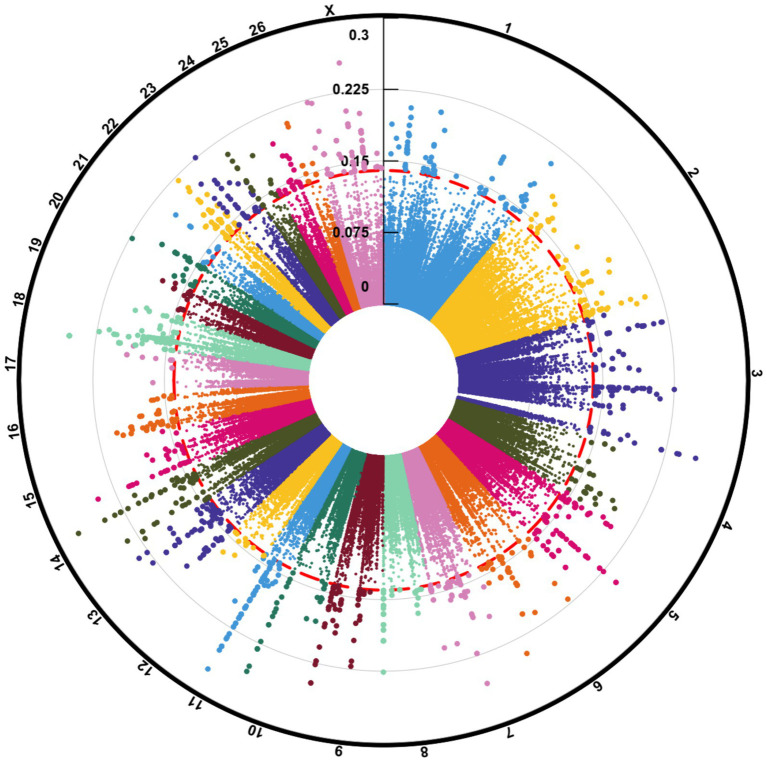
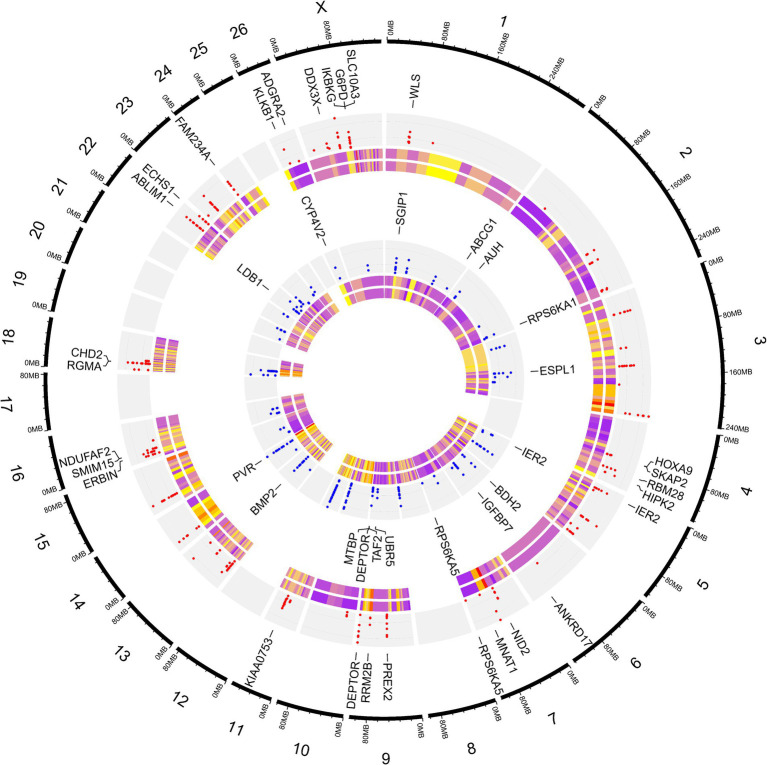
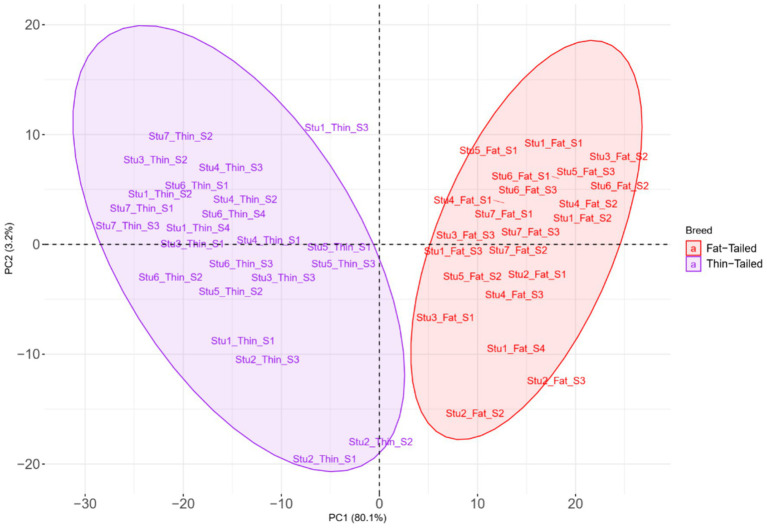
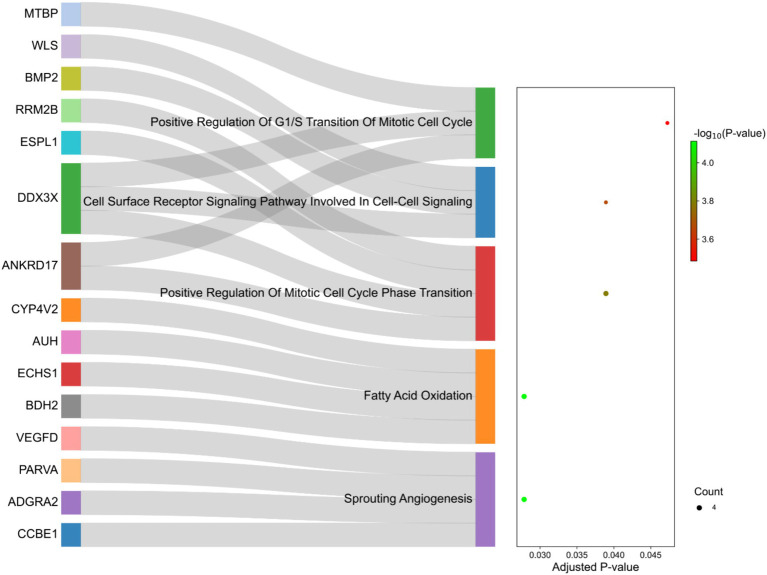
Understanding the genetic background behind fat-tail development in sheep can be useful to develop breeding programs for genetic improvement, while the genetic basis of fat-tail formation is still not well understood. Here, to identify genomic regions influencing fat-tail size in sheep, a comprehensive selection signature identification analysis was performed through comparison of fat- and thin-tailed sheep breeds. Furthermore, to gain the first insights into the potential use of RNA-Seq for selection signature identification analysis, SNP calling was performed using RNA-Seq datasets. In total, 45 RNA-Seq samples from seven cohort studies were analyzed, and the FST method was used to detect selection signatures. Our findings indicated that RNA-Seq could be of potential utility for selection signature identification analysis. In total, 877 SNPs related to 103 genes were found to be under selection in 92 genomic regions. Functional annotation analysis reinforced the hypothesis that genes involved in fatty acid oxidation May modulate fat accumulation in the tail of sheep and highlighted the potential regulatory role of angiogenesis process in the fat deposition. In agreement with most previous studies, our results re-emphasize that the BMP2 gene is targeted by selection during sheep evolution. Further gene annotation analysis of the regions targeted by the sheep evolution process revealed that a large number of genes included in these regions are directly associated with fat metabolism, including those previously reported as candidates involved in sheep fat-tail morphology, such as NID2, IKBKG, RGMA, IGFBP7, UBR5, VEGFD and WLS. Moreover, a number of genes, including BDH2, ECHS1, AUH, ERBIN and CYP4V2 were of particular interest because they are well-known fat metabolism-associated genes and are considered novel candidates involved in fat-tail size. Consistent with the selection signature identification analysis, principal component analysis clustered the samples into two completely separate groups according to fat- and thin-tailed breeds. Our results provide novel insights into the genomic basis of phenotypic diversity related to the fat-tail of sheep breeds and can be used to determine directions for improving breeding strategies in the future.
Keywords: RNA-Seq datasets; SNP calling; fat deposition; selection signatures; thin- and fat-tailed sheep.
Copyright © 2024 Abbasabadi, Bakhtiarizadeh, Moradi and McEwan.
Conflict of interest statement
The authors declare that the research was conducted in the absence of any commercial or financial relationships that could be construed as a potential conflict of interest. The author(s) declared that they were an editorial board member of Frontiers, at the time of submission. This had no impact on the peer review process and the final decision.
Figures
Similar articles
-
RNA-Seq based genetic variant discovery provides new insights into controlling fat deposition in the tail of sheep.Sci Rep. 2020 Aug 11;10(1):13525. doi: 10.1038/s41598-020-70527-8. Sci Rep. 2020. PMID: 32782325 Free PMC article.
-
Hitchhiking Mapping of Candidate Regions Associated with Fat Deposition in Iranian Thin and Fat Tail Sheep Breeds Suggests New Insights into Molecular Aspects of Fat Tail Selection.Animals (Basel). 2022 May 31;12(11):1423. doi: 10.3390/ani12111423. Animals (Basel). 2022. PMID: 35681887 Free PMC article.
-
Genomic Scan for Selection Signature Reveals Fat Deposition in Chinese Indigenous Sheep with Extreme Tail Types.Animals (Basel). 2020 Apr 29;10(5):773. doi: 10.3390/ani10050773. Animals (Basel). 2020. PMID: 32365604 Free PMC article.
-
Deciphering the role of alternative splicing as a potential regulator in fat-tail development of sheep: a comprehensive RNA-seq based study.Sci Rep. 2024 Jan 29;14(1):2361. doi: 10.1038/s41598-024-52855-1. Sci Rep. 2024. PMID: 38287039 Free PMC article. Review.
-
Trends towards revealing the genetic architecture of sheep tail patterning: Promising genes and investigatory pathways.Anim Genet. 2021 Dec;52(6):799-812. doi: 10.1111/age.13133. Epub 2021 Sep 1. Anim Genet. 2021. PMID: 34472112 Review.
Cited by
-
Fat-tail allele-specific expression genes may affect fat deposition in tail of sheep.PLoS One. 2024 Dec 27;19(12):e0316046. doi: 10.1371/journal.pone.0316046. eCollection 2024. PLoS One. 2024. PMID: 39729475 Free PMC article.
References
LinkOut - more resources
Full Text Sources
Miscellaneous